Confirming you are not from the U.S. or the Philippines

โดยการให้คำชี้แจงนี้ ข้าพเจ้าขอประกาศและยืนยันอย่างชัดเจนว่า:
  • ข้าพเจ้ามิใช่พลเมืองหรือผู้ที่พำนักอาศัยสหรัฐอเมริกา
  • ฉันไม่ใช่ผู้พำนักอาศัยในฟิลิปปินส์
  • ข้าพเจ้าไม่ได้เป็นเจ้าของหุ้น/สิทธิ์ในการออกเสียง/ผลประโยชน์ของผู้พำนักในสหรัฐอเมริกาทั้งทางตรงและทางอ้อมเกินกว่า 10% และ/หรือไม่ได้ควบคุมพลเมืองหรือผู้พำนักในสหรัฐอเมริกาด้วยวิธีการอื่น
  • ข้าพเจ้าไม่ได้อยู่ภายใต้ความเป็นเจ้าของโดยตรงหรือโดยอ้อมมากกว่า 10% ของจำนวนหุ้น/สิทธิในการออกเสียง/ดอกเบี้ยและ/หรืออยู่ภายใต้การควบคุมของพลเมืองสหรัฐอเมริกาหรือผู้พำนักอาศัยโดยใช้วิธีการอื่น
  • ข้าพเจ้าไม่มีส่วนเกี่ยวข้องกับพลเมืองหรือผู้พำนักในสหรัฐอเมริกาตามมาตรา 1504(a) ของ FATCA
  • ข้าพเจ้าตระหนักดีถึงความรับผิดของข้าพเจ้าในการแสดงข้อความอันเป็นเท็จ
สำหรับวัตถุประสงค์ของคำชี้แจงนี้ ประเทศและดินแดนที่อยู่ภายใต้การปกครองของสหรัฐอเมริกาทั้งหมดจะเท่ากับอาณาเขตหลักของสหรัฐอเมริกา ข้าพเจ้าให้คำมั่นที่จะปกป้องและปกป้อง Octa Markets Incorporated กรรมการและเจ้าหน้าที่ของ Octa Markets Incorporated จากการเรียกร้องใด ๆ ที่เกิดขึ้นจากหรือเกี่ยวข้องกับการละเมิดคำชี้แจงของข้าพเจ้าในที่นี้
เราทุ่มเทให้กับความเป็นส่วนตัวและความปลอดภัยของข้อมูลส่วนบุคคลของคุณ เรารวบรวมอีเมลเพื่อมอบข้อเสนอพิเศษและข้อมูลสำคัญเกี่ยวกับผลิตภัณฑ์และบริการของเราเท่านั้น โดยการมอบที่อยู่อีเมลของคุณ คุณตกลงที่จะรับจดหมายดังกล่าวจากเรา หากคุณต้องการบอกเลิกการรับจดหมายหรือมีคำถามหรือข้อสงสัยใด ๆ กรุณาส่งไปที่ฝ่ายบริการลูกค้าของเรา
Octa trading broker
เปิดบัญชีการเทรด
Test

Important information

By using this website, you confirm you are not a resident of the European Union, the United States of America, the United Kingdom, Iran, Myanmar, North Korea, Norway, Iceland, Switzerland, Liechtenstein, and the Philippines or accessing it from these jurisdictions. We assume no liability for the consequences of non-compliance with local laws.

Back

GBP/USD Price Analysis: Bulls are solid after a Symmetrical Triangle breakout above 1.1900

  • A breakout of a symmetrical triangle states an expansion in volatility that results in wider ticks and heavy volume.
  • Advancing 20-and 50-EMAs indicate more upside ahead.
  • The RSI (14) has shifted into the bullish range of 60.00-80.00, which adds to the upside filters.

The GBP/USD pair has refreshed its three-day high at 1.1903 in the early Asian session as investors’ risk appetite is improving dramatically. The Cable is expected to display more gains as the US dollar index (DXY) is facing sheer pressure due to a significant recovery in the risk-on profile.

The DXY witnessed a steep fall after failing to recapture the round-level resistance of 108.00. Volatility in the DXY counter is expected to remain at the rooftop as investors eye the release of Federal Open Market Committee (FOMC) minutes and the US Durable Goods Orders.

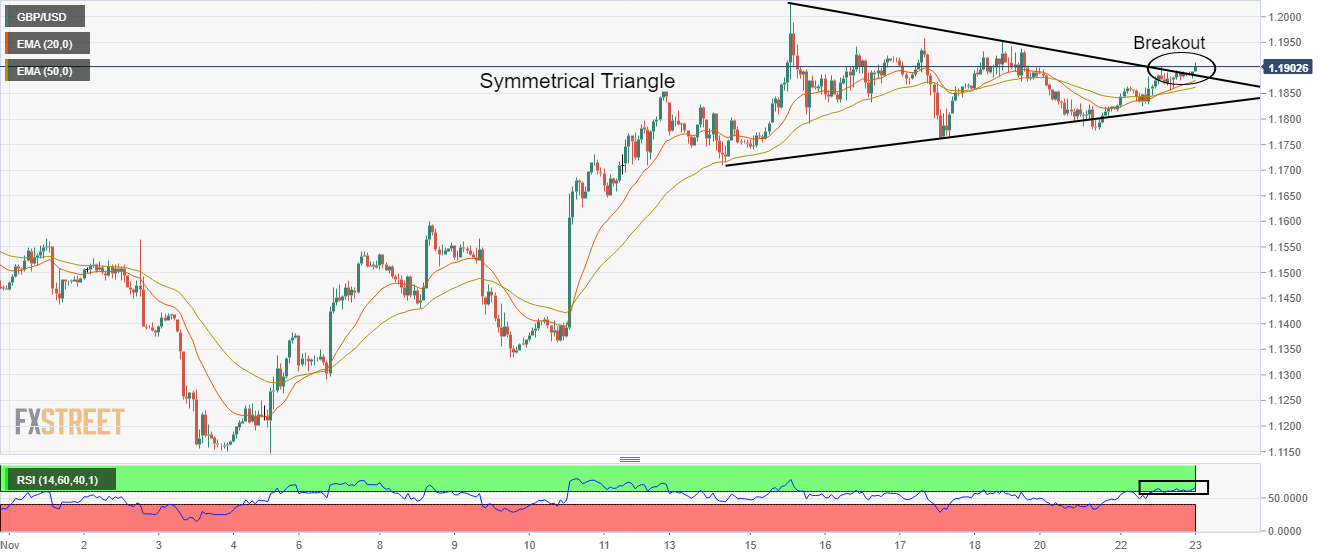
On an hourly scale, the Cable has delivered a breakout of the Symmetrical Triangle chart pattern, which will result in wider ticks and heavy volume. The asset is surpassed the downward-sloping trendline plotted from November 15 high at 1.2029 while the upward-sloping trendline of the chart pattern is placed from November 14 low at 1.1710.

The asset is auctioning above the 20-and 50-period Exponential Moving Averages (EMAs) at 1.1876 and 1.1863 respectively, which adds to the upside filters.

Also, the Relative Strength Index (RSI) (14) has shifted into the bullish range of 60.00-80.00, which favors a bullish momentum.

For a decisive upside, the Cable needs to break Friday’s high at 1.1950, which will drive the asset towards November 15 high at 1.2029, followed by the round-level resistance at 1.2100.

On the flip side, a drop below Monday’s low at 1.1780 will drag the asset toward November 14 low at 1.1710. A slippage below November 14 low will expose the asset to the horizontal support plotted from October 27 high at 1.1646.

GBP/USD hourly chart


EUR/USD Price Analysis: Bulls poke 1.0320 hurdle to aim for 200-DMA

EUR/USD prints mild gains around 1.0320 as buyers keep the previous day’s rebound from a one-week low during early Wednesday. In doing so, the major c
อ่านเพิ่มเติม Previous

USD/JPY bulls still in play but focus will switch to the downside on break of 138.80

USD/JPY is on the back foot and is testing 141.00 with a low of 140.90 so far. The US Dollar retreated across the board on Tuesday and remains on the
อ่านเพิ่มเติม Next