Confirming you are not from the U.S. or the Philippines

โดยการให้คำชี้แจงนี้ ข้าพเจ้าขอประกาศและยืนยันอย่างชัดเจนว่า:
  • ข้าพเจ้ามิใช่พลเมืองหรือผู้ที่พำนักอาศัยสหรัฐอเมริกา
  • ฉันไม่ใช่ผู้พำนักอาศัยในฟิลิปปินส์
  • ข้าพเจ้าไม่ได้เป็นเจ้าของหุ้น/สิทธิ์ในการออกเสียง/ผลประโยชน์ของผู้พำนักในสหรัฐอเมริกาทั้งทางตรงและทางอ้อมเกินกว่า 10% และ/หรือไม่ได้ควบคุมพลเมืองหรือผู้พำนักในสหรัฐอเมริกาด้วยวิธีการอื่น
  • ข้าพเจ้าไม่ได้อยู่ภายใต้ความเป็นเจ้าของโดยตรงหรือโดยอ้อมมากกว่า 10% ของจำนวนหุ้น/สิทธิในการออกเสียง/ดอกเบี้ยและ/หรืออยู่ภายใต้การควบคุมของพลเมืองสหรัฐอเมริกาหรือผู้พำนักอาศัยโดยใช้วิธีการอื่น
  • ข้าพเจ้าไม่มีส่วนเกี่ยวข้องกับพลเมืองหรือผู้พำนักในสหรัฐอเมริกาตามมาตรา 1504(a) ของ FATCA
  • ข้าพเจ้าตระหนักดีถึงความรับผิดของข้าพเจ้าในการแสดงข้อความอันเป็นเท็จ
สำหรับวัตถุประสงค์ของคำชี้แจงนี้ ประเทศและดินแดนที่อยู่ภายใต้การปกครองของสหรัฐอเมริกาทั้งหมดจะเท่ากับอาณาเขตหลักของสหรัฐอเมริกา ข้าพเจ้าให้คำมั่นที่จะปกป้องและปกป้อง Octa Markets Incorporated กรรมการและเจ้าหน้าที่ของ Octa Markets Incorporated จากการเรียกร้องใด ๆ ที่เกิดขึ้นจากหรือเกี่ยวข้องกับการละเมิดคำชี้แจงของข้าพเจ้าในที่นี้
เราทุ่มเทให้กับความเป็นส่วนตัวและความปลอดภัยของข้อมูลส่วนบุคคลของคุณ เรารวบรวมอีเมลเพื่อมอบข้อเสนอพิเศษและข้อมูลสำคัญเกี่ยวกับผลิตภัณฑ์และบริการของเราเท่านั้น โดยการมอบที่อยู่อีเมลของคุณ คุณตกลงที่จะรับจดหมายดังกล่าวจากเรา หากคุณต้องการบอกเลิกการรับจดหมายหรือมีคำถามหรือข้อสงสัยใด ๆ กรุณาส่งไปที่ฝ่ายบริการลูกค้าของเรา
Octa trading broker
เปิดบัญชีการเทรด
Test
Back

Natural Gas Price Analysis: XNG/USD retreats from multi-day-old resistance line to around $2.60

  • Natural Gas consolidates the biggest daily jump in a month by retreating from three-week high.
  • RSI conditions favor pullback moves from 3.5-month-old resistance line.
  • April’s top restricts immediate downside, 50-EMA appears the key support.

Natural Gas Price (XNG/USD) prints the first daily loss in five as it eases from the highest levels in three weeks to $2.60 early Friday. In doing so, the XNG/USD consolidates the biggest daily gains in one month as energy market players reassess the previous day’s rally amid a light calendar and mixed sentiment.

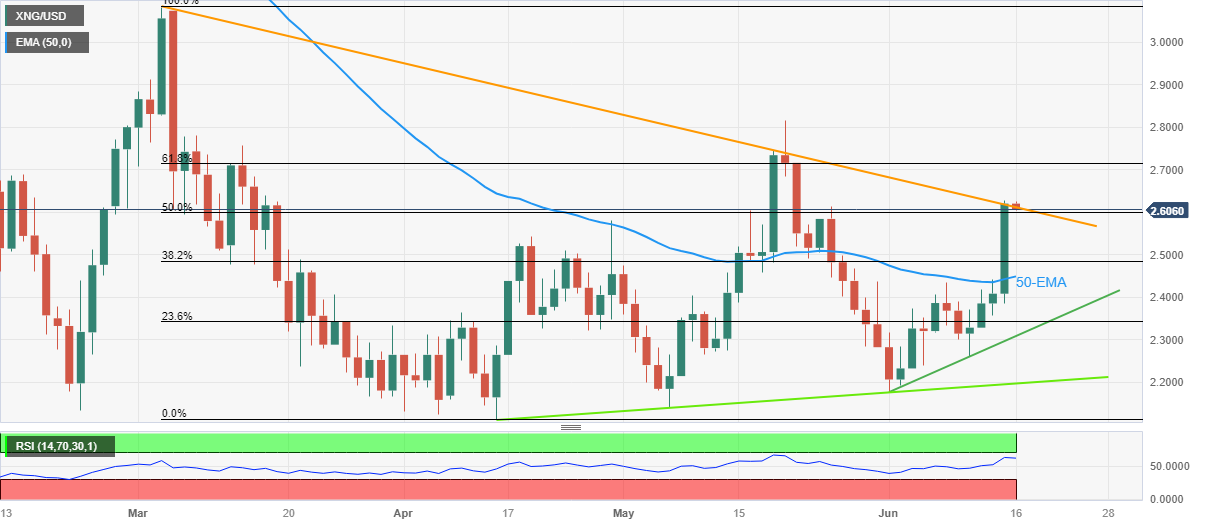
That said, the energy instrument’s failure to provide a daily closing beyond a downward-sloping resistance line from March 03 appears to favor the intraday sellers of the Natural Gas.

Adding strength to the pullback moves is the RSI (14) line that retreats from the nearly overbought territory. As a result, the Natural Gas Price may witness further declines, at least for the short term.

However, April’s monthly high of around $2.58 and multiple levels marked near the $2.50 round figure limit the immediate downside of the XNG/USD.

Following that, the 50-day Exponential Moving Average (EMA) around $2.45 becomes crucial to watch for the Natural Gas bears as a break of which could direct the quote toward the monthly support line of near $2.30.

On the flip side, XNG/USD recovery needs to provide a daily close beyond the latest peak of around $2.63 could quickly propel the Natural Gas Price to the 61.8% Fibonacci retracement level of March-April moves, near $2.71.

It should be noted, however, that the previous monthly high of around $2.81 acts as the final defense of the Natural Gas bears.

Natural Gas Price: Daily chart

Trend: Limited downside expected

GBP/USD looks to reclaim 1.2800 mark for the first time since April 2022 on weaker USD

The GBP/USD pair trades with a mild positive bias for the fourth successive day on Friday and touches its highest level since April 2022 during the As
อ่านเพิ่มเติม Previous

USD/CAD Price Analysis: Bulls make a move within bearish territory

The Canadian Dollar strengthened to a nine-month high vs. the Greenback on Thursday and into an area of temporary support as the following technical a
อ่านเพิ่มเติม Next