Confirming you are not from the U.S. or the Philippines

โดยการให้คำชี้แจงนี้ ข้าพเจ้าขอประกาศและยืนยันอย่างชัดเจนว่า:
  • ข้าพเจ้ามิใช่พลเมืองหรือผู้ที่พำนักอาศัยสหรัฐอเมริกา
  • ฉันไม่ใช่ผู้พำนักอาศัยในฟิลิปปินส์
  • ข้าพเจ้าไม่ได้เป็นเจ้าของหุ้น/สิทธิ์ในการออกเสียง/ผลประโยชน์ของผู้พำนักในสหรัฐอเมริกาทั้งทางตรงและทางอ้อมเกินกว่า 10% และ/หรือไม่ได้ควบคุมพลเมืองหรือผู้พำนักในสหรัฐอเมริกาด้วยวิธีการอื่น
  • ข้าพเจ้าไม่ได้อยู่ภายใต้ความเป็นเจ้าของโดยตรงหรือโดยอ้อมมากกว่า 10% ของจำนวนหุ้น/สิทธิในการออกเสียง/ดอกเบี้ยและ/หรืออยู่ภายใต้การควบคุมของพลเมืองสหรัฐอเมริกาหรือผู้พำนักอาศัยโดยใช้วิธีการอื่น
  • ข้าพเจ้าไม่มีส่วนเกี่ยวข้องกับพลเมืองหรือผู้พำนักในสหรัฐอเมริกาตามมาตรา 1504(a) ของ FATCA
  • ข้าพเจ้าตระหนักดีถึงความรับผิดของข้าพเจ้าในการแสดงข้อความอันเป็นเท็จ
สำหรับวัตถุประสงค์ของคำชี้แจงนี้ ประเทศและดินแดนที่อยู่ภายใต้การปกครองของสหรัฐอเมริกาทั้งหมดจะเท่ากับอาณาเขตหลักของสหรัฐอเมริกา ข้าพเจ้าให้คำมั่นที่จะปกป้องและปกป้อง Octa Markets Incorporated กรรมการและเจ้าหน้าที่ของ Octa Markets Incorporated จากการเรียกร้องใด ๆ ที่เกิดขึ้นจากหรือเกี่ยวข้องกับการละเมิดคำชี้แจงของข้าพเจ้าในที่นี้
เราทุ่มเทให้กับความเป็นส่วนตัวและความปลอดภัยของข้อมูลส่วนบุคคลของคุณ เรารวบรวมอีเมลเพื่อมอบข้อเสนอพิเศษและข้อมูลสำคัญเกี่ยวกับผลิตภัณฑ์และบริการของเราเท่านั้น โดยการมอบที่อยู่อีเมลของคุณ คุณตกลงที่จะรับจดหมายดังกล่าวจากเรา หากคุณต้องการบอกเลิกการรับจดหมายหรือมีคำถามหรือข้อสงสัยใด ๆ กรุณาส่งไปที่ฝ่ายบริการลูกค้าของเรา
Octa trading broker
เปิดบัญชีการเทรด
Back

AUD/USD Price Analysis: Bull Flag continuation pattern probably in process of completing

  • AUD/USD is probably completing a Bull Flag continuation pattern with bullish implications. 
  • A break above the May 16 high would validate the pattern and indicate more upside to the pattern’s price targets. 
  • The pair has drifted sideways into support from the bottom of a rising channel and reached a pivotal moment in its evolution. 

AUD/USD is potentially forming a Bull Flag continuation pattern on the 4-hour chart. These patterns are composed of a sharp rally – the “flagpole” – followed by a rectangular consolidation – the “flag square”. 

Bull Flags are a sign the uptrend is taking a pause before continuing higher. The subsequent rally can be estimated by taking the length of the flagpole and extrapolating it from the base of the consolidation higher, or a Fibonacci ratio of the length. 

A break above the top of the flag square (shaded rectangle on chart below) at around the 0.6714 May 16 highs, would confirm activation of the Bull Flag. Such a move would be expected to extend the uptrend up to an initial target at 0.6728, the 0.618 Fibonacci extension of the flagpole. A second more optimistic price objective lies at 0.6788, the full length of the flagpole. 

AUD/USD 4-hour Chart
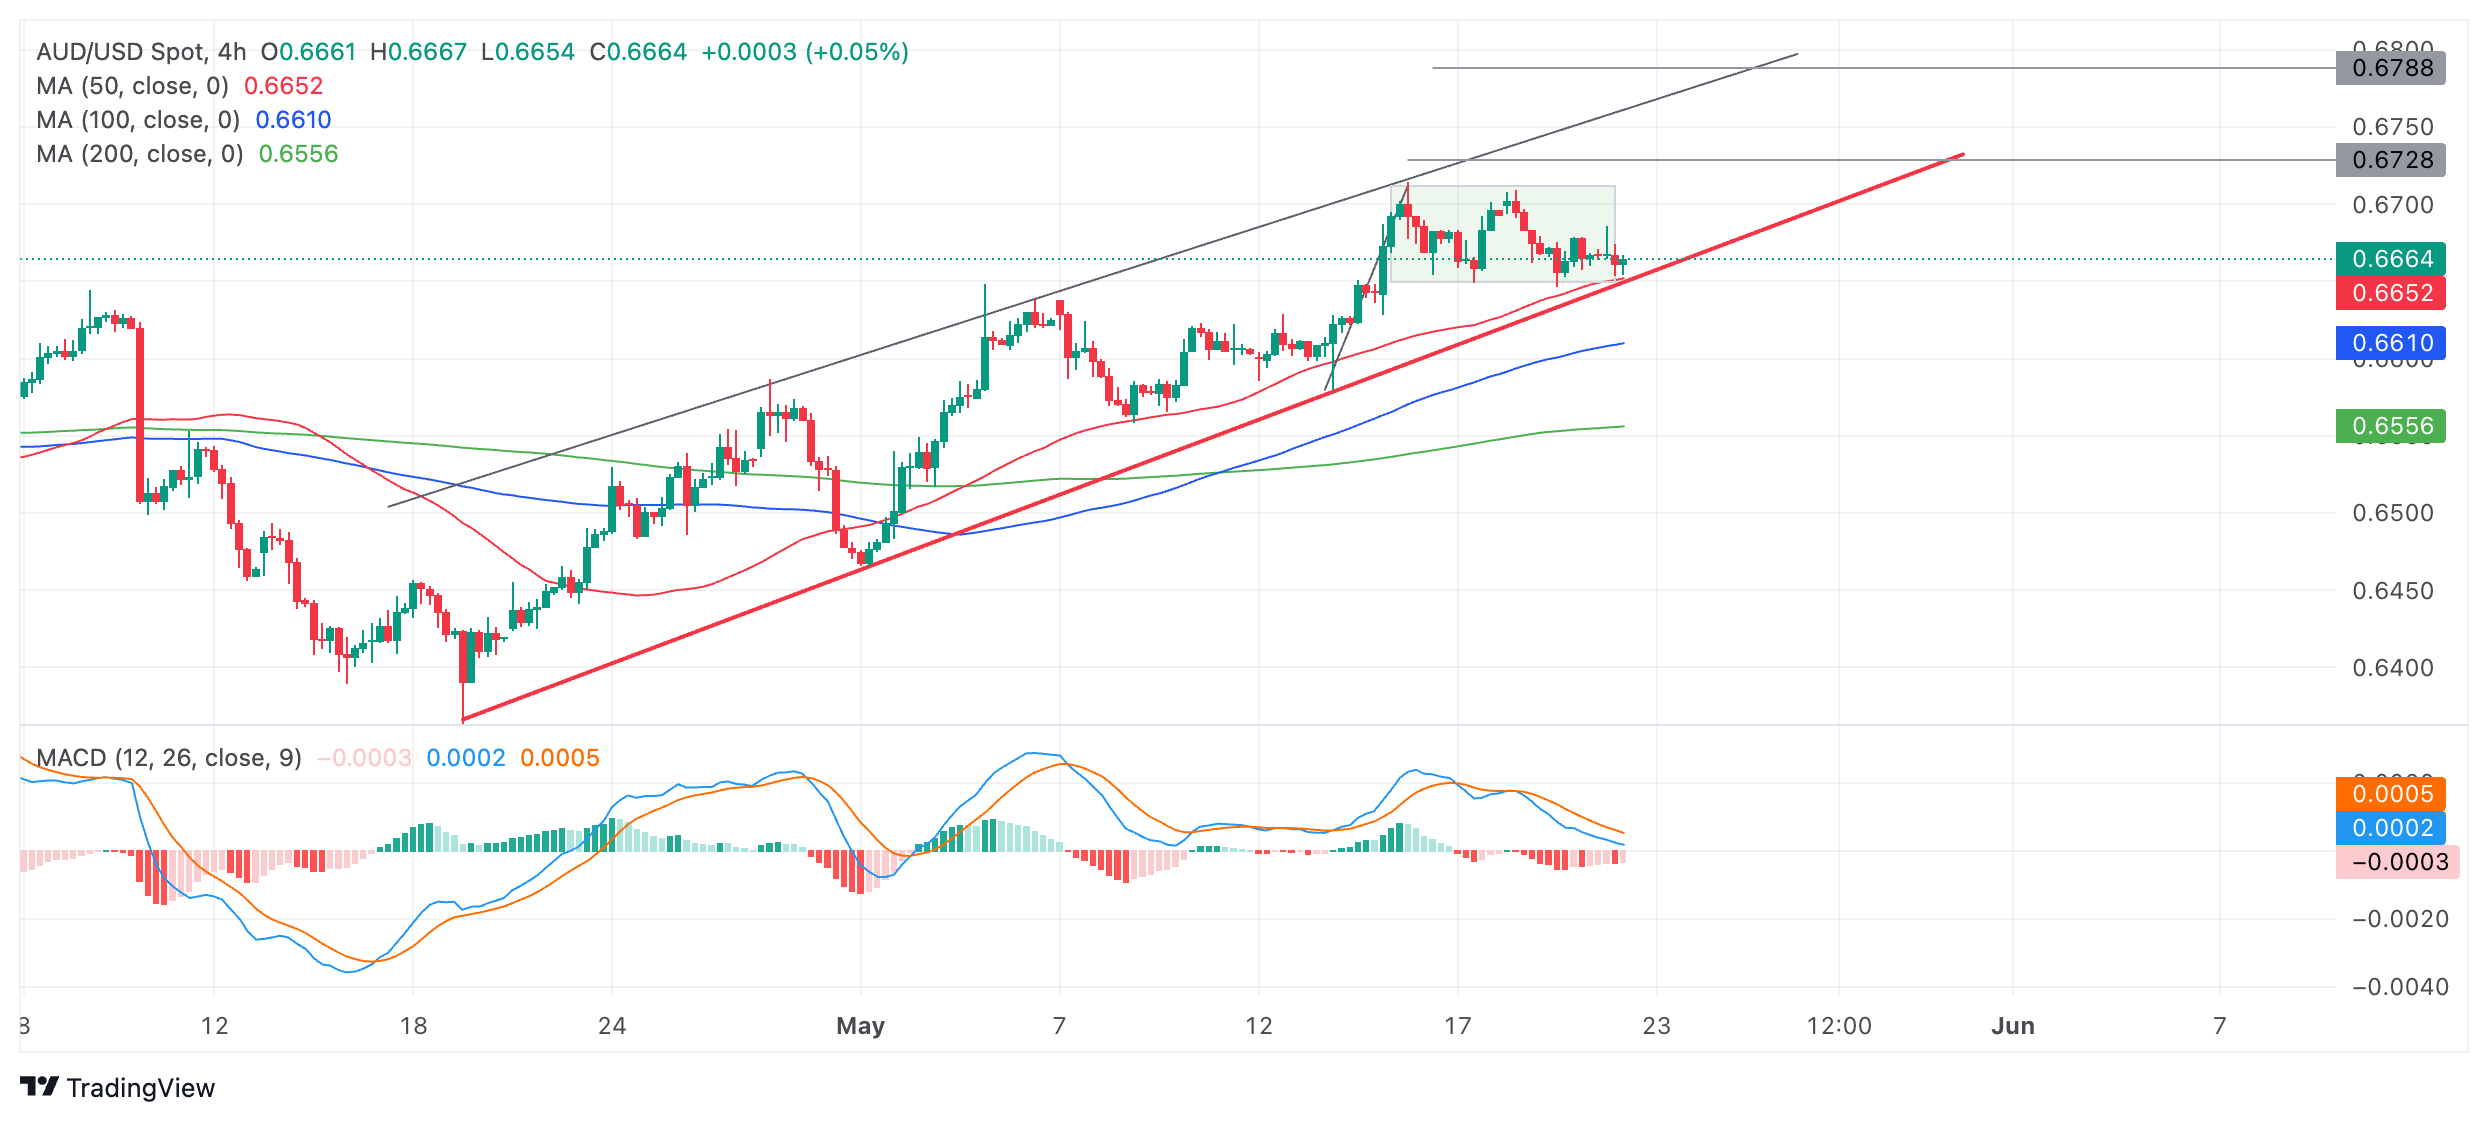
The Aussie is in a rising channel and price has now pulled back to the red lower trendline of the channel. This indicates price has reached a pivotal moment – if it breaks higher it will validate the Bull Flag hypothesis and activate the patterns targets. This is the more likely outcome given the AUD/USD is in a short-term uptrend, and as the old saying goes, “the trend is your friend”. 

However, a decisive break below the red trendline would invalidate the Bull Flag and bring the short-term uptrend into doubt. 

A decisive break would be characterized as one that was accompanied by a long red candle that closed near its low or three red candles in a row that broke through the trendline.


US Dollar consolidates further as markets gear up for increased volatility

The US Dollar (USD) is drifting as markets await a volatile 24 hours ahead which will commence with the release of the Federal Reserve (Fed) Minutes from the recent Federal Open Market Committee (FOMC) decision on why they kept rates stable.
อ่านเพิ่มเติม Previous

United States MBA Mortgage Applications climbed from previous 0.5% to 1.9% in May 17

United States MBA Mortgage Applications climbed from previous 0.5% to 1.9% in May 17
อ่านเพิ่มเติม Next