Confirming you are not from the U.S. or the Philippines

โดยการให้คำชี้แจงนี้ ข้าพเจ้าขอประกาศและยืนยันอย่างชัดเจนว่า:
  • ข้าพเจ้ามิใช่พลเมืองหรือผู้ที่พำนักอาศัยสหรัฐอเมริกา
  • ฉันไม่ใช่ผู้พำนักอาศัยในฟิลิปปินส์
  • ข้าพเจ้าไม่ได้เป็นเจ้าของหุ้น/สิทธิ์ในการออกเสียง/ผลประโยชน์ของผู้พำนักในสหรัฐอเมริกาทั้งทางตรงและทางอ้อมเกินกว่า 10% และ/หรือไม่ได้ควบคุมพลเมืองหรือผู้พำนักในสหรัฐอเมริกาด้วยวิธีการอื่น
  • ข้าพเจ้าไม่ได้อยู่ภายใต้ความเป็นเจ้าของโดยตรงหรือโดยอ้อมมากกว่า 10% ของจำนวนหุ้น/สิทธิในการออกเสียง/ดอกเบี้ยและ/หรืออยู่ภายใต้การควบคุมของพลเมืองสหรัฐอเมริกาหรือผู้พำนักอาศัยโดยใช้วิธีการอื่น
  • ข้าพเจ้าไม่มีส่วนเกี่ยวข้องกับพลเมืองหรือผู้พำนักในสหรัฐอเมริกาตามมาตรา 1504(a) ของ FATCA
  • ข้าพเจ้าตระหนักดีถึงความรับผิดของข้าพเจ้าในการแสดงข้อความอันเป็นเท็จ
สำหรับวัตถุประสงค์ของคำชี้แจงนี้ ประเทศและดินแดนที่อยู่ภายใต้การปกครองของสหรัฐอเมริกาทั้งหมดจะเท่ากับอาณาเขตหลักของสหรัฐอเมริกา ข้าพเจ้าให้คำมั่นที่จะปกป้องและปกป้อง Octa Markets Incorporated กรรมการและเจ้าหน้าที่ของ Octa Markets Incorporated จากการเรียกร้องใด ๆ ที่เกิดขึ้นจากหรือเกี่ยวข้องกับการละเมิดคำชี้แจงของข้าพเจ้าในที่นี้
เราทุ่มเทให้กับความเป็นส่วนตัวและความปลอดภัยของข้อมูลส่วนบุคคลของคุณ เรารวบรวมอีเมลเพื่อมอบข้อเสนอพิเศษและข้อมูลสำคัญเกี่ยวกับผลิตภัณฑ์และบริการของเราเท่านั้น โดยการมอบที่อยู่อีเมลของคุณ คุณตกลงที่จะรับจดหมายดังกล่าวจากเรา หากคุณต้องการบอกเลิกการรับจดหมายหรือมีคำถามหรือข้อสงสัยใด ๆ กรุณาส่งไปที่ฝ่ายบริการลูกค้าของเรา
Octa trading broker
เปิดบัญชีการเทรด
Back

USD/JPY Price Analysis: Closes in on resistance with possibility of temporary pullback

  • USD/JPY closes in on a resistance level at former highs. 
  • The pair could pullback temporarily from the technical resistance level. 
  • The uptrend remains intact, however, suggesting further upside will probably eventually follow. 


USD/JPY has rallied up to retest technical resistance at around 156.79 (May 14 high), and there is a possibility it could temporarily falter. 

USD/JPY Daily Chart
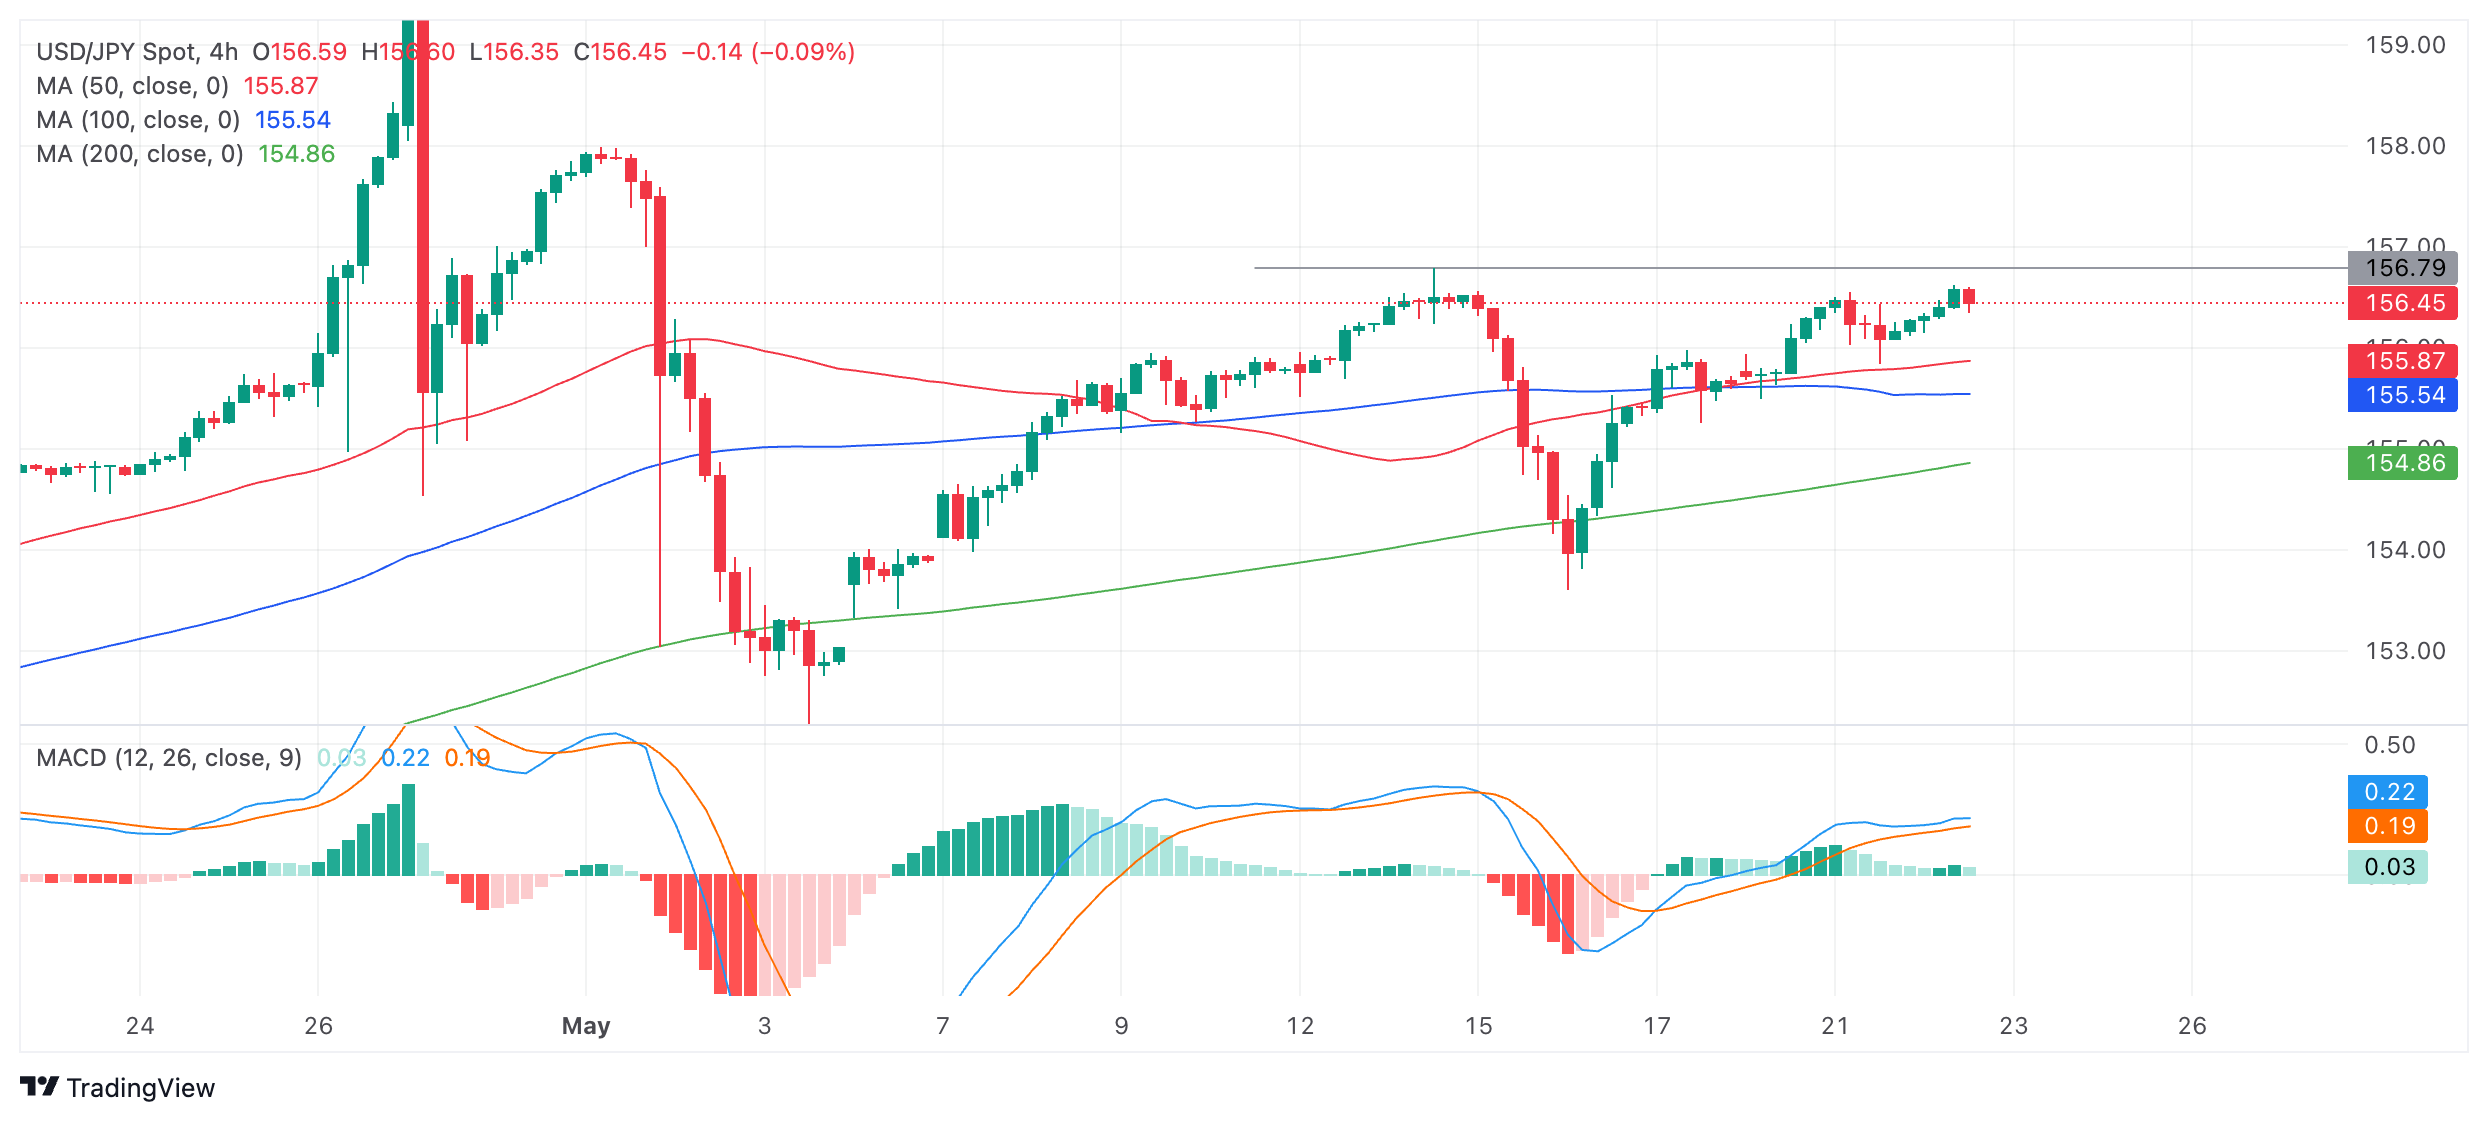
USD/JPY is in an uptrend on all timeframes, however, and given “the trend is your friend” this favors more upside eventually even if there is a correction at the aforementioned resistance level. 

The Moving Average Convergence Divergence (MACD) momentum indicator is showing a lack of momentum in the most recent move up from the May 16 lows, which could be a warning sign. The blue MACD line has not crossed below the red signal line, however, as would be expected to accompany the beginning of a deeper pullback. 

If USD/JPY corrects it will probably find support at the level of the cluster of Moving Averages between 155.50-80. 

A break above the resistance level at 156.79 on a 4-hour period closing basis would indicate a continuation of the uptrend, with the next upside target probably at the 157.98 May 1 high.

United States EIA Crude Oil Stocks Change came in at 1.825M, above forecasts (-3.1M) in May 17

United States EIA Crude Oil Stocks Change came in at 1.825M, above forecasts (-3.1M) in May 17
อ่านเพิ่มเติม Previous

EUR/GBP retreats as chances of BoE's June cut plunge after UK's CPI

The EUR/GBP traded lower falling to 0.8505 on Wednesday after the Pound garnered strength following the Office for National Statistics (ONS) releasing inflation data higher than the market's expectations.
อ่านเพิ่มเติม Next