Confirming you are not from the U.S. or the Philippines

โดยการให้คำชี้แจงนี้ ข้าพเจ้าขอประกาศและยืนยันอย่างชัดเจนว่า:
  • ข้าพเจ้ามิใช่พลเมืองหรือผู้ที่พำนักอาศัยสหรัฐอเมริกา
  • ฉันไม่ใช่ผู้พำนักอาศัยในฟิลิปปินส์
  • ข้าพเจ้าไม่ได้เป็นเจ้าของหุ้น/สิทธิ์ในการออกเสียง/ผลประโยชน์ของผู้พำนักในสหรัฐอเมริกาทั้งทางตรงและทางอ้อมเกินกว่า 10% และ/หรือไม่ได้ควบคุมพลเมืองหรือผู้พำนักในสหรัฐอเมริกาด้วยวิธีการอื่น
  • ข้าพเจ้าไม่ได้อยู่ภายใต้ความเป็นเจ้าของโดยตรงหรือโดยอ้อมมากกว่า 10% ของจำนวนหุ้น/สิทธิในการออกเสียง/ดอกเบี้ยและ/หรืออยู่ภายใต้การควบคุมของพลเมืองสหรัฐอเมริกาหรือผู้พำนักอาศัยโดยใช้วิธีการอื่น
  • ข้าพเจ้าไม่มีส่วนเกี่ยวข้องกับพลเมืองหรือผู้พำนักในสหรัฐอเมริกาตามมาตรา 1504(a) ของ FATCA
  • ข้าพเจ้าตระหนักดีถึงความรับผิดของข้าพเจ้าในการแสดงข้อความอันเป็นเท็จ
สำหรับวัตถุประสงค์ของคำชี้แจงนี้ ประเทศและดินแดนที่อยู่ภายใต้การปกครองของสหรัฐอเมริกาทั้งหมดจะเท่ากับอาณาเขตหลักของสหรัฐอเมริกา ข้าพเจ้าให้คำมั่นที่จะปกป้องและปกป้อง Octa Markets Incorporated กรรมการและเจ้าหน้าที่ของ Octa Markets Incorporated จากการเรียกร้องใด ๆ ที่เกิดขึ้นจากหรือเกี่ยวข้องกับการละเมิดคำชี้แจงของข้าพเจ้าในที่นี้
เราทุ่มเทให้กับความเป็นส่วนตัวและความปลอดภัยของข้อมูลส่วนบุคคลของคุณ เรารวบรวมอีเมลเพื่อมอบข้อเสนอพิเศษและข้อมูลสำคัญเกี่ยวกับผลิตภัณฑ์และบริการของเราเท่านั้น โดยการมอบที่อยู่อีเมลของคุณ คุณตกลงที่จะรับจดหมายดังกล่าวจากเรา หากคุณต้องการบอกเลิกการรับจดหมายหรือมีคำถามหรือข้อสงสัยใด ๆ กรุณาส่งไปที่ฝ่ายบริการลูกค้าของเรา
Octa trading broker
เปิดบัญชีการเทรด
Back

AUD/JPY Price Analysis: Cross enters in consolidation phase, downturn likely momentary

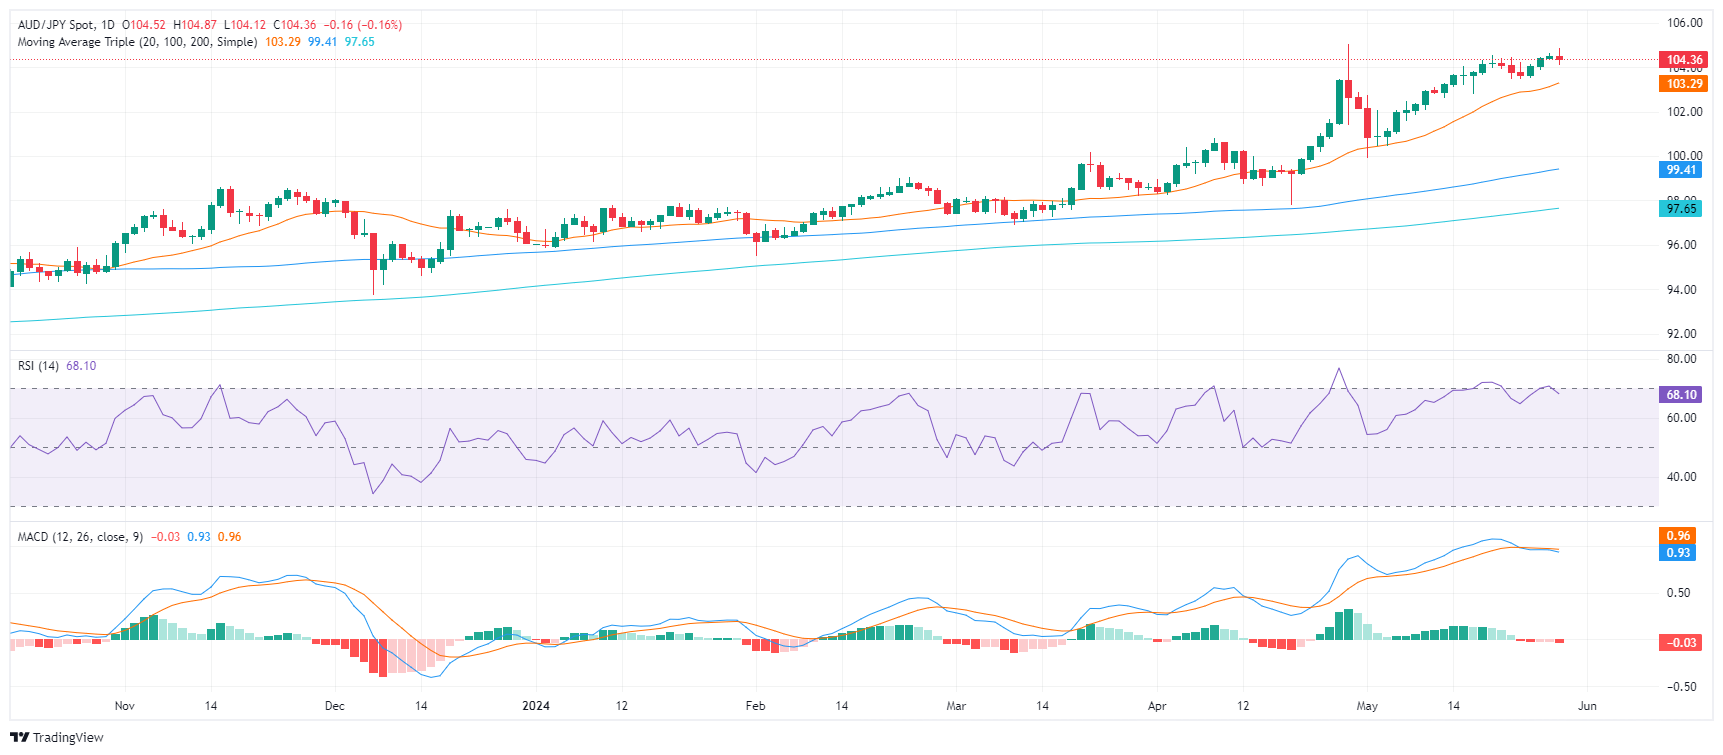
  • Daily chart indicators suggest correction phase sets in; RSI drops signifying easing of overbought conditions.
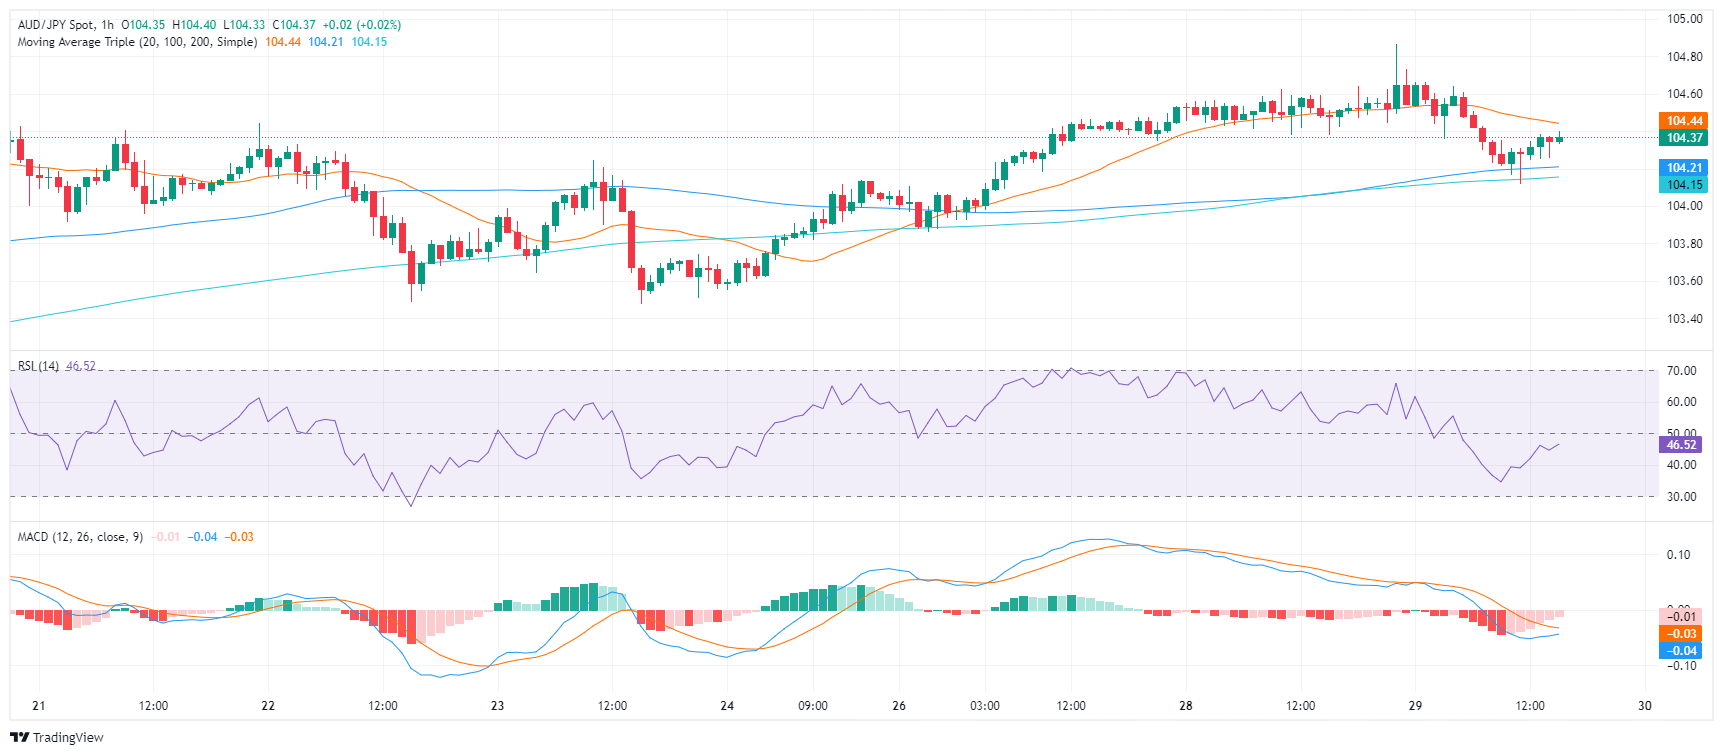
  • Hourly chart indicators remain in negative territory, signaling downside correction in the near term.
  • Bulls show signs of exhaustion, unable to retest 105.00 highs.

In Wednesday's session, the AUD/JPY pair displayed signs of correction, retreating to the 104.30 mark following an earlier surge to 104.90. Seemingly, buyers are finding it tough to maintain upward traction. The market appears to have started a short-term correction phase.

On the daily chart, the RSI has edged down to 67 territory, indicating easing of earlier overbought conditions. In sync with this, MACD continues to print red bars, further solidifying the possibility of weakening buying power.

AUD/JPY daily chart

Reiterating these sentiments is the hourly chart. The RSI and MACD both remain in negative territory, indicating a probable near-term correction.

AUD/JPY hourly chart

The prominent resistance remains the cycle high just above 105.00 while the 20-day SMA, now at 103.29, continues to provide strong support.


AUD/JPY

Overview
Today last price 104.38
Today Daily Change -0.14
Today Daily Change % -0.13
Today daily open 104.52
 
Trends
Daily SMA20 103.12
Daily SMA50 101.15
Daily SMA100 99.35
Daily SMA200 97.59
 
Levels
Previous Daily High 104.62
Previous Daily Low 104.35
Previous Weekly High 104.56
Previous Weekly Low 103.48
Previous Monthly High 105.04
Previous Monthly Low 97.78
Daily Fibonacci 38.2% 104.52
Daily Fibonacci 61.8% 104.45
Daily Pivot Point S1 104.37
Daily Pivot Point S2 104.22
Daily Pivot Point S3 104.1
Daily Pivot Point R1 104.65
Daily Pivot Point R2 104.78
Daily Pivot Point R3 104.93


Dow Jones Industrial Average tumbles almost 400 points on Wednesday

The Dow Jones Industrial Average (DJIA) is broadly lower on Wednesday, shedding nearly 400 points and backsliding into 38,500.00.
อ่านเพิ่มเติม Previous

Gold price tumbles on Wednesday as rising US yields boost Greenback

Gold prices slump on Wednesday amid rising US Treasury yields, boosting demand for the Greenback due to hawkish comments by a Federal Reserve (Fed) official.
อ่านเพิ่มเติม Next