Confirming you are not from the U.S. or the Philippines

โดยการให้คำชี้แจงนี้ ข้าพเจ้าขอประกาศและยืนยันอย่างชัดเจนว่า:
  • ข้าพเจ้ามิใช่พลเมืองหรือผู้ที่พำนักอาศัยสหรัฐอเมริกา
  • ฉันไม่ใช่ผู้พำนักอาศัยในฟิลิปปินส์
  • ข้าพเจ้าไม่ได้เป็นเจ้าของหุ้น/สิทธิ์ในการออกเสียง/ผลประโยชน์ของผู้พำนักในสหรัฐอเมริกาทั้งทางตรงและทางอ้อมเกินกว่า 10% และ/หรือไม่ได้ควบคุมพลเมืองหรือผู้พำนักในสหรัฐอเมริกาด้วยวิธีการอื่น
  • ข้าพเจ้าไม่ได้อยู่ภายใต้ความเป็นเจ้าของโดยตรงหรือโดยอ้อมมากกว่า 10% ของจำนวนหุ้น/สิทธิในการออกเสียง/ดอกเบี้ยและ/หรืออยู่ภายใต้การควบคุมของพลเมืองสหรัฐอเมริกาหรือผู้พำนักอาศัยโดยใช้วิธีการอื่น
  • ข้าพเจ้าไม่มีส่วนเกี่ยวข้องกับพลเมืองหรือผู้พำนักในสหรัฐอเมริกาตามมาตรา 1504(a) ของ FATCA
  • ข้าพเจ้าตระหนักดีถึงความรับผิดของข้าพเจ้าในการแสดงข้อความอันเป็นเท็จ
สำหรับวัตถุประสงค์ของคำชี้แจงนี้ ประเทศและดินแดนที่อยู่ภายใต้การปกครองของสหรัฐอเมริกาทั้งหมดจะเท่ากับอาณาเขตหลักของสหรัฐอเมริกา ข้าพเจ้าให้คำมั่นที่จะปกป้องและปกป้อง Octa Markets Incorporated กรรมการและเจ้าหน้าที่ของ Octa Markets Incorporated จากการเรียกร้องใด ๆ ที่เกิดขึ้นจากหรือเกี่ยวข้องกับการละเมิดคำชี้แจงของข้าพเจ้าในที่นี้
เราทุ่มเทให้กับความเป็นส่วนตัวและความปลอดภัยของข้อมูลส่วนบุคคลของคุณ เรารวบรวมอีเมลเพื่อมอบข้อเสนอพิเศษและข้อมูลสำคัญเกี่ยวกับผลิตภัณฑ์และบริการของเราเท่านั้น โดยการมอบที่อยู่อีเมลของคุณ คุณตกลงที่จะรับจดหมายดังกล่าวจากเรา หากคุณต้องการบอกเลิกการรับจดหมายหรือมีคำถามหรือข้อสงสัยใด ๆ กรุณาส่งไปที่ฝ่ายบริการลูกค้าของเรา
Back

GBP/USD Price Analysis: Recovers above 1.2700 amid soft US Dollar

  • GBP/USD bounces back off weekly lows around 1.2680.
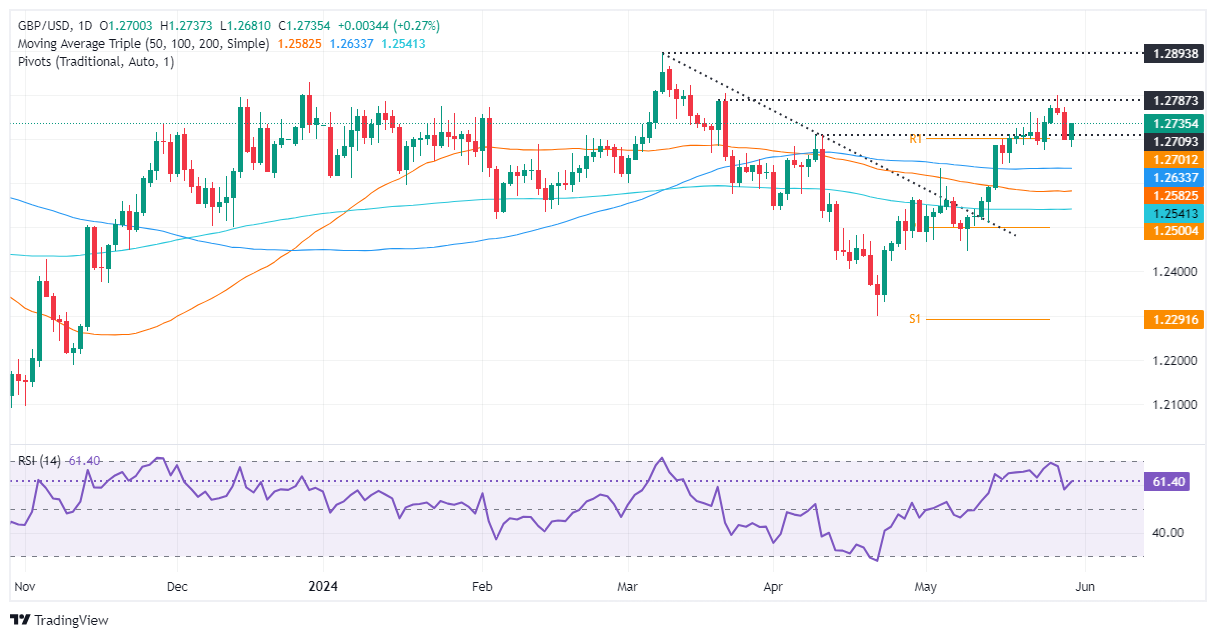
  • Technical outlook shows neutral to upward bias, with key resistance at 1.2803.
  • Critical support levels include May 24 low at 1.2674 and the 50-DMA at 1.2581.

The Pound Sterling recovered some ground against the US Dollar on Thursday, as US Treasury yields are sliding, undermining the Greenback. Consequently, the GBP/USD bounced off weekly lows, reached 1.2680, and traded at 1.2728, gaining 0.20%.

GBP/USD Price Analysis: Technical outlook

The daily chart suggests the GBP/USD is neutral to upward bias, but the buyer's failure to crack the March 21 daily high at 1.2803 opened the door for a pullback. Although momentum remains bullish, as shown by the Relative Strength Index (RSI), buying pressure begins to fade after testing 1.2800.

For a bullish continuation, the GBP/USD needs to surpass 1.2803. That would sponsor a rally to the year-to-date (YTD) high of 1.2893, followed by 1.2900. Overhead resistance lies ahead, with 1.3000 seen as a crucial resistance.

Conversely, if sellers move in decisively and push the major below 1.2700, further losses lie ahead. Key support levels would be tested. Initially, the May 24 low of 1.2674, followed by the 1.2600 mark. Down below, the 50-day moving average (DMA) at 1.2581 awaits.

GBP/USD Price Action – Daily Chart

GBP/USD

Overview
Today last price 1.273
Today Daily Change 0.0029
Today Daily Change % 0.23
Today daily open 1.2701
 
Trends
Daily SMA20 1.2635
Daily SMA50 1.2581
Daily SMA100 1.2634
Daily SMA200 1.2541
 
Levels
Previous Daily High 1.2772
Previous Daily Low 1.2699
Previous Weekly High 1.2761
Previous Weekly Low 1.2676
Previous Monthly High 1.2709
Previous Monthly Low 1.23
Daily Fibonacci 38.2% 1.2727
Daily Fibonacci 61.8% 1.2744
Daily Pivot Point S1 1.2676
Daily Pivot Point S2 1.2651
Daily Pivot Point S3 1.2604
Daily Pivot Point R1 1.2749
Daily Pivot Point R2 1.2797
Daily Pivot Point R3 1.2821


USD/CHF plunges below 0.9050 amid soft US Dollar and robust Swiss Q1 GDP growth

The USD/CHF pair has been hit hard and has plunged to near 0.9040 in Thursday’s American session.
อ่านเพิ่มเติม Previous

United States EIA Crude Oil Stocks Change below expectations (-1.9M) in May 24: Actual (-4.156M)

United States EIA Crude Oil Stocks Change below expectations (-1.9M) in May 24: Actual (-4.156M)
อ่านเพิ่มเติม Next