Confirming you are not from the U.S. or the Philippines

โดยการให้คำชี้แจงนี้ ข้าพเจ้าขอประกาศและยืนยันอย่างชัดเจนว่า:
  • ข้าพเจ้ามิใช่พลเมืองหรือผู้ที่พำนักอาศัยสหรัฐอเมริกา
  • ฉันไม่ใช่ผู้พำนักอาศัยในฟิลิปปินส์
  • ข้าพเจ้าไม่ได้เป็นเจ้าของหุ้น/สิทธิ์ในการออกเสียง/ผลประโยชน์ของผู้พำนักในสหรัฐอเมริกาทั้งทางตรงและทางอ้อมเกินกว่า 10% และ/หรือไม่ได้ควบคุมพลเมืองหรือผู้พำนักในสหรัฐอเมริกาด้วยวิธีการอื่น
  • ข้าพเจ้าไม่ได้อยู่ภายใต้ความเป็นเจ้าของโดยตรงหรือโดยอ้อมมากกว่า 10% ของจำนวนหุ้น/สิทธิในการออกเสียง/ดอกเบี้ยและ/หรืออยู่ภายใต้การควบคุมของพลเมืองสหรัฐอเมริกาหรือผู้พำนักอาศัยโดยใช้วิธีการอื่น
  • ข้าพเจ้าไม่มีส่วนเกี่ยวข้องกับพลเมืองหรือผู้พำนักในสหรัฐอเมริกาตามมาตรา 1504(a) ของ FATCA
  • ข้าพเจ้าตระหนักดีถึงความรับผิดของข้าพเจ้าในการแสดงข้อความอันเป็นเท็จ
สำหรับวัตถุประสงค์ของคำชี้แจงนี้ ประเทศและดินแดนที่อยู่ภายใต้การปกครองของสหรัฐอเมริกาทั้งหมดจะเท่ากับอาณาเขตหลักของสหรัฐอเมริกา ข้าพเจ้าให้คำมั่นที่จะปกป้องและปกป้อง Octa Markets Incorporated กรรมการและเจ้าหน้าที่ของ Octa Markets Incorporated จากการเรียกร้องใด ๆ ที่เกิดขึ้นจากหรือเกี่ยวข้องกับการละเมิดคำชี้แจงของข้าพเจ้าในที่นี้
เราทุ่มเทให้กับความเป็นส่วนตัวและความปลอดภัยของข้อมูลส่วนบุคคลของคุณ เรารวบรวมอีเมลเพื่อมอบข้อเสนอพิเศษและข้อมูลสำคัญเกี่ยวกับผลิตภัณฑ์และบริการของเราเท่านั้น โดยการมอบที่อยู่อีเมลของคุณ คุณตกลงที่จะรับจดหมายดังกล่าวจากเรา หากคุณต้องการบอกเลิกการรับจดหมายหรือมีคำถามหรือข้อสงสัยใด ๆ กรุณาส่งไปที่ฝ่ายบริการลูกค้าของเรา
Octa trading broker
เปิดบัญชีการเทรด
Back

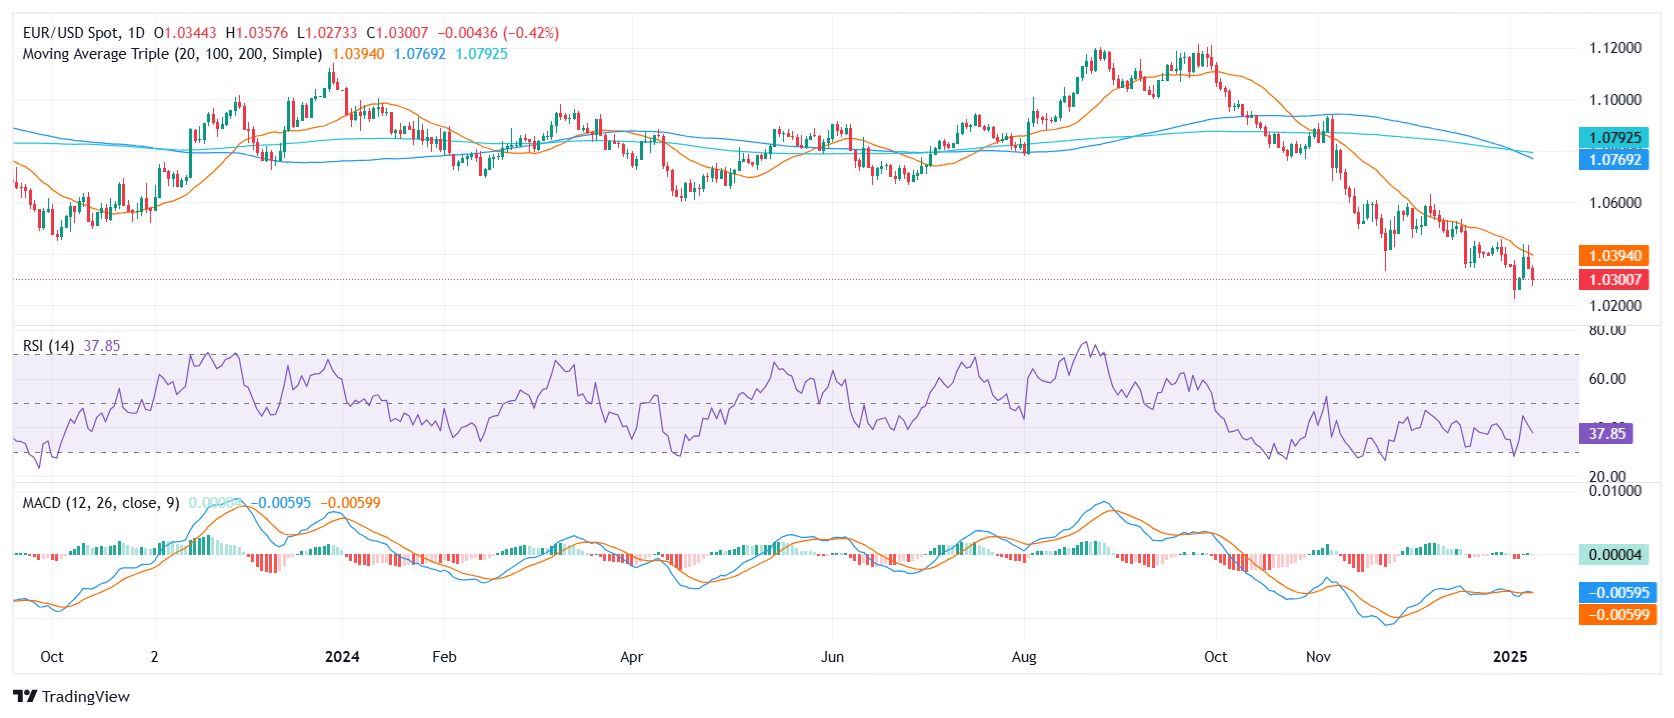
EUR/USD Price Analysis: Pair slides below 1.0300, indicators lose steam

  • EUR/USD declines by 0.48% on Wednesday, settling near 1.0295 after failing to break above the 20-day SMA.
  • RSI falls sharply to 39 in negative territory, revealing intensified selling pressure.
  • MACD histogram prints decreasing green bars, suggesting waning bullish momentum and a renewed downside tilt.

EUR/USD struggled on Wednesday, shedding 0.48% to trade around 1.0295. This latest drop underscores the pair’s inability to sustain any meaningful recovery, as multiple attempts to breach the 20-day Simple Moving Average (SMA) since early 2025 have been met with forceful selling. As a result, bullish momentum appears to be receding, leaving sellers firmly in control of the near-term price action.

Technical readings paint a downbeat picture. The Relative Strength Index (RSI) has dropped to 39, reinforcing the notion that downward pressure is picking up pace. Meanwhile, the Moving Average Convergence Divergence (MACD) histogram shows a decline in green bars, hinting that any previous efforts by buyers have begun to fade. Despite these setbacks, a definitive move above the 20-day SMA would still represent the clearest signal of a reversal, should buyers regroup and attempt another push higher.

Until that materializes, however, the path of least resistance remains tilted to the downside. Traders will keep a close watch on incoming macro catalysts and price action around the 20-day SMA for early signs of a possible turnaround.

EUR/USD daily chart

United States EIA Crude Oil Stocks Change below forecasts (-0.25M) in January 3: Actual (-0.959M)

United States EIA Crude Oil Stocks Change below forecasts (-0.25M) in January 3: Actual (-0.959M)
อ่านเพิ่มเติม Previous

United States EIA Natural Gas Storage Change below forecasts (-39B) in January 3: Actual (-40B)

United States EIA Natural Gas Storage Change below forecasts (-39B) in January 3: Actual (-40B)
อ่านเพิ่มเติม Next