Confirming you are not from the U.S. or the Philippines

โดยการให้คำชี้แจงนี้ ข้าพเจ้าขอประกาศและยืนยันอย่างชัดเจนว่า:
  • ข้าพเจ้ามิใช่พลเมืองหรือผู้ที่พำนักอาศัยสหรัฐอเมริกา
  • ฉันไม่ใช่ผู้พำนักอาศัยในฟิลิปปินส์
  • ข้าพเจ้าไม่ได้เป็นเจ้าของหุ้น/สิทธิ์ในการออกเสียง/ผลประโยชน์ของผู้พำนักในสหรัฐอเมริกาทั้งทางตรงและทางอ้อมเกินกว่า 10% และ/หรือไม่ได้ควบคุมพลเมืองหรือผู้พำนักในสหรัฐอเมริกาด้วยวิธีการอื่น
  • ข้าพเจ้าไม่ได้อยู่ภายใต้ความเป็นเจ้าของโดยตรงหรือโดยอ้อมมากกว่า 10% ของจำนวนหุ้น/สิทธิในการออกเสียง/ดอกเบี้ยและ/หรืออยู่ภายใต้การควบคุมของพลเมืองสหรัฐอเมริกาหรือผู้พำนักอาศัยโดยใช้วิธีการอื่น
  • ข้าพเจ้าไม่มีส่วนเกี่ยวข้องกับพลเมืองหรือผู้พำนักในสหรัฐอเมริกาตามมาตรา 1504(a) ของ FATCA
  • ข้าพเจ้าตระหนักดีถึงความรับผิดของข้าพเจ้าในการแสดงข้อความอันเป็นเท็จ
สำหรับวัตถุประสงค์ของคำชี้แจงนี้ ประเทศและดินแดนที่อยู่ภายใต้การปกครองของสหรัฐอเมริกาทั้งหมดจะเท่ากับอาณาเขตหลักของสหรัฐอเมริกา ข้าพเจ้าให้คำมั่นที่จะปกป้องและปกป้อง Octa Markets Incorporated กรรมการและเจ้าหน้าที่ของ Octa Markets Incorporated จากการเรียกร้องใด ๆ ที่เกิดขึ้นจากหรือเกี่ยวข้องกับการละเมิดคำชี้แจงของข้าพเจ้าในที่นี้
เราทุ่มเทให้กับความเป็นส่วนตัวและความปลอดภัยของข้อมูลส่วนบุคคลของคุณ เรารวบรวมอีเมลเพื่อมอบข้อเสนอพิเศษและข้อมูลสำคัญเกี่ยวกับผลิตภัณฑ์และบริการของเราเท่านั้น โดยการมอบที่อยู่อีเมลของคุณ คุณตกลงที่จะรับจดหมายดังกล่าวจากเรา หากคุณต้องการบอกเลิกการรับจดหมายหรือมีคำถามหรือข้อสงสัยใด ๆ กรุณาส่งไปที่ฝ่ายบริการลูกค้าของเรา
Octa trading broker
เปิดบัญชีการเทรด
Back

EUR/USD Price Analysis: Bulls lose momentum as pair faces rejection at 100-day SMA

  • EUR/USD slips 0.22% to 1.0450 on Friday, reversing after testing the 100-day SMA.
  • RSI drops sharply to 55, signaling weakening bullish momentum near the midpoint.
  • MACD histogram prints lower green bars, indicating fading buying pressure and potential for further downside.

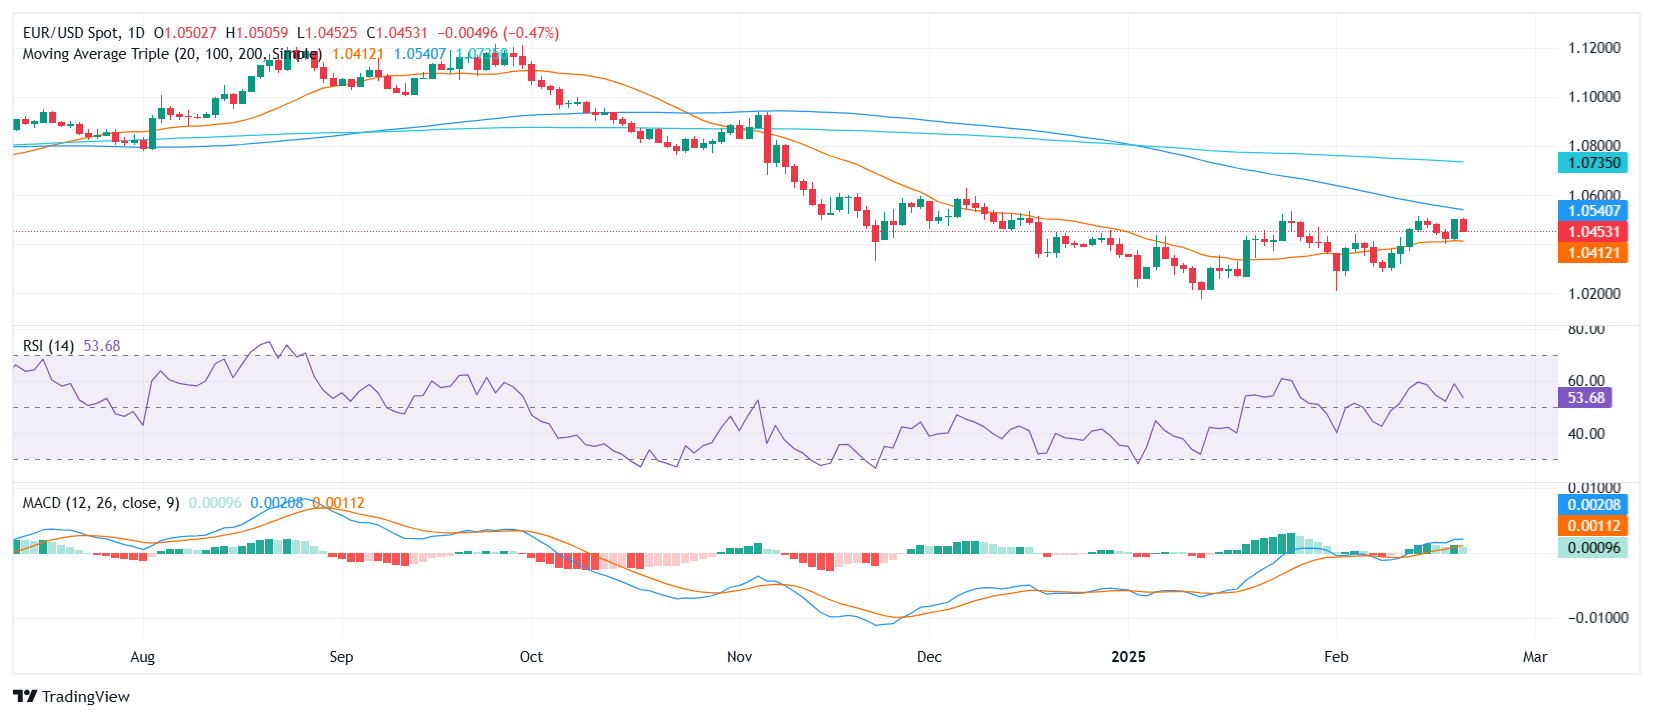
The EUR/USD pair faced a setback on Friday, declining by 0.44% to settle near 1.0450 after encountering firm resistance at the 100-day Simple Moving Average (SMA) around 1.0540. This rejection marks a critical turning point for the pair, suggesting that bullish momentum is beginning to wane after a recent run higher. Without a decisive break above this key level, bulls appear to be losing their grip on the market.

Technical indicators are reinforcing the weakening outlook. The Relative Strength Index (RSI) has fallen sharply to 55, approaching the neutral midpoint, which could signal a shift in sentiment if breached. Meanwhile, the Moving Average Convergence Divergence (MACD) histogram is showing flat green bars with a downward tilt, reflecting diminishing buying pressure and growing risk of a bearish reversal.

If EUR/USD fails to reclaim the 100-day SMA in the near term, the recent upward move could be deemed a temporary correction rather than a structural shift. The pair may either retreat further or become range-bound between the 100-day SMA resistance and the 20-day SMA, which could act as initial support around the 1.0415 region. A sustained break below the 20-day SMA would further solidify the bearish outlook.

EUR/USD daily chart

GBP/USD slips after hitting record high past 100-day SMA

The GBP/USD registers losses during the North American session after testing the 100-day Simple Moving Average (SMA) at 1.2658.
อ่านเพิ่มเติม Previous

United States Baker Hughes US Oil Rig Count increased to 487 from previous 481

United States Baker Hughes US Oil Rig Count increased to 487 from previous 481
อ่านเพิ่มเติม Next