Confirming you are not from the U.S. or the Philippines

โดยการให้คำชี้แจงนี้ ข้าพเจ้าขอประกาศและยืนยันอย่างชัดเจนว่า:
  • ข้าพเจ้ามิใช่พลเมืองหรือผู้ที่พำนักอาศัยสหรัฐอเมริกา
  • ฉันไม่ใช่ผู้พำนักอาศัยในฟิลิปปินส์
  • ข้าพเจ้าไม่ได้เป็นเจ้าของหุ้น/สิทธิ์ในการออกเสียง/ผลประโยชน์ของผู้พำนักในสหรัฐอเมริกาทั้งทางตรงและทางอ้อมเกินกว่า 10% และ/หรือไม่ได้ควบคุมพลเมืองหรือผู้พำนักในสหรัฐอเมริกาด้วยวิธีการอื่น
  • ข้าพเจ้าไม่ได้อยู่ภายใต้ความเป็นเจ้าของโดยตรงหรือโดยอ้อมมากกว่า 10% ของจำนวนหุ้น/สิทธิในการออกเสียง/ดอกเบี้ยและ/หรืออยู่ภายใต้การควบคุมของพลเมืองสหรัฐอเมริกาหรือผู้พำนักอาศัยโดยใช้วิธีการอื่น
  • ข้าพเจ้าไม่มีส่วนเกี่ยวข้องกับพลเมืองหรือผู้พำนักในสหรัฐอเมริกาตามมาตรา 1504(a) ของ FATCA
  • ข้าพเจ้าตระหนักดีถึงความรับผิดของข้าพเจ้าในการแสดงข้อความอันเป็นเท็จ
สำหรับวัตถุประสงค์ของคำชี้แจงนี้ ประเทศและดินแดนที่อยู่ภายใต้การปกครองของสหรัฐอเมริกาทั้งหมดจะเท่ากับอาณาเขตหลักของสหรัฐอเมริกา ข้าพเจ้าให้คำมั่นที่จะปกป้องและปกป้อง Octa Markets Incorporated กรรมการและเจ้าหน้าที่ของ Octa Markets Incorporated จากการเรียกร้องใด ๆ ที่เกิดขึ้นจากหรือเกี่ยวข้องกับการละเมิดคำชี้แจงของข้าพเจ้าในที่นี้
เราทุ่มเทให้กับความเป็นส่วนตัวและความปลอดภัยของข้อมูลส่วนบุคคลของคุณ เรารวบรวมอีเมลเพื่อมอบข้อเสนอพิเศษและข้อมูลสำคัญเกี่ยวกับผลิตภัณฑ์และบริการของเราเท่านั้น โดยการมอบที่อยู่อีเมลของคุณ คุณตกลงที่จะรับจดหมายดังกล่าวจากเรา หากคุณต้องการบอกเลิกการรับจดหมายหรือมีคำถามหรือข้อสงสัยใด ๆ กรุณาส่งไปที่ฝ่ายบริการลูกค้าของเรา
Octa trading broker
เปิดบัญชีการเทรด
Back

EUR/USD Price Analysis: Bulls struggle as pair retreats from 100-day SMA

  • EUR/USD posts mild gains but faces rejection near the 100-day SMA.
  • RSI remains in positive territory but shows signs of fading bullish momentum.

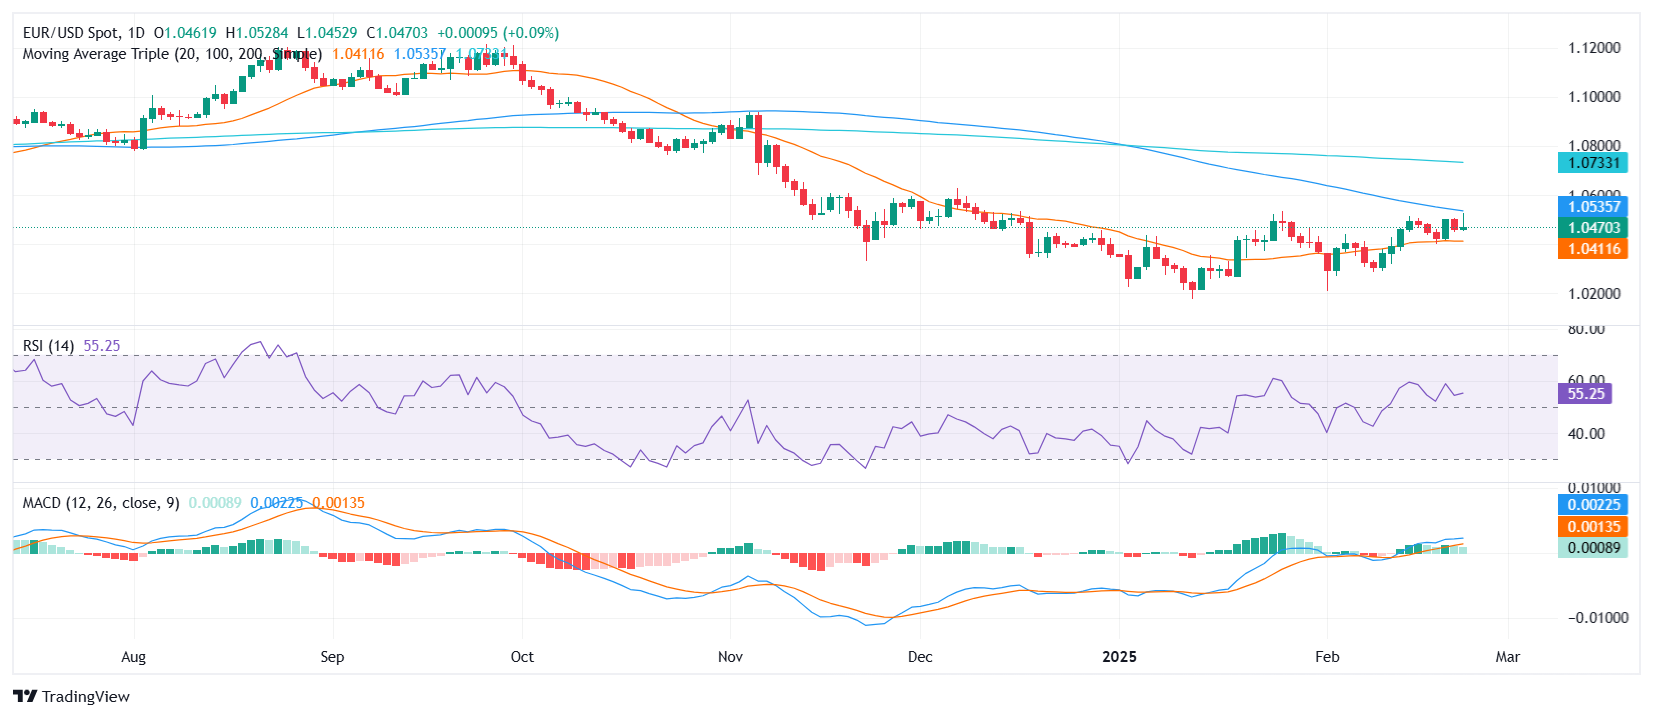
The EUR/USD pair started the week on a cautiously positive note, climbing toward recent highs before encountering strong resistance near the 100-day Simple Moving Average (SMA). After briefly reaching the 1.0530 area, the pair lost momentum and pulled back toward the 1.0470 zone. This retreat suggests that bullish efforts are beginning to stall, with sellers gradually regaining control.

Technical signals highlight this shift in sentiment. The Relative Strength Index (RSI) remains in positive territory but is flattening, indicating that bullish momentum may be running out of steam. The Moving Average Convergence Divergence (MACD) histogram shows flat green bars, reinforcing the notion of weakening upward pressure. Without a decisive break above the 100-day SMA, bulls could struggle to maintain control.

In the short term, the key focus will be on whether the pair can defend support around the 1.0450 zone. A break below this level could invite further losses, pushing the pair toward the 20-day SMA. On the upside, a clear breach of the 100-day SMA would be required to revive bullish momentum and open the door for a sustained recovery. For now, the technical indicators suggest that time may be running out for the bulls to regain traction.

EUR/USD daily chart
Gold price hits all-time high at $2,956 as trade uncertainty lingers

Gold's price rose to a new record high of $2,956 in early trading on Monday during the North American session as the Greenback stayed firm and US yields remained virtually unchanged.
อ่านเพิ่มเติม Previous

GBP/USD holds firm after hitting 9-week high

The Pound Sterling remains firm against the Greenback during the North American session on Monday yet retraced earlier gains after hitting a 9-week high of 1.2690 amid some US dollar weakness.
อ่านเพิ่มเติม Next