Confirming you are not from the U.S. or the Philippines

โดยการให้คำชี้แจงนี้ ข้าพเจ้าขอประกาศและยืนยันอย่างชัดเจนว่า:
  • ข้าพเจ้ามิใช่พลเมืองหรือผู้ที่พำนักอาศัยสหรัฐอเมริกา
  • ฉันไม่ใช่ผู้พำนักอาศัยในฟิลิปปินส์
  • ข้าพเจ้าไม่ได้เป็นเจ้าของหุ้น/สิทธิ์ในการออกเสียง/ผลประโยชน์ของผู้พำนักในสหรัฐอเมริกาทั้งทางตรงและทางอ้อมเกินกว่า 10% และ/หรือไม่ได้ควบคุมพลเมืองหรือผู้พำนักในสหรัฐอเมริกาด้วยวิธีการอื่น
  • ข้าพเจ้าไม่ได้อยู่ภายใต้ความเป็นเจ้าของโดยตรงหรือโดยอ้อมมากกว่า 10% ของจำนวนหุ้น/สิทธิในการออกเสียง/ดอกเบี้ยและ/หรืออยู่ภายใต้การควบคุมของพลเมืองสหรัฐอเมริกาหรือผู้พำนักอาศัยโดยใช้วิธีการอื่น
  • ข้าพเจ้าไม่มีส่วนเกี่ยวข้องกับพลเมืองหรือผู้พำนักในสหรัฐอเมริกาตามมาตรา 1504(a) ของ FATCA
  • ข้าพเจ้าตระหนักดีถึงความรับผิดของข้าพเจ้าในการแสดงข้อความอันเป็นเท็จ
สำหรับวัตถุประสงค์ของคำชี้แจงนี้ ประเทศและดินแดนที่อยู่ภายใต้การปกครองของสหรัฐอเมริกาทั้งหมดจะเท่ากับอาณาเขตหลักของสหรัฐอเมริกา ข้าพเจ้าให้คำมั่นที่จะปกป้องและปกป้อง Octa Markets Incorporated กรรมการและเจ้าหน้าที่ของ Octa Markets Incorporated จากการเรียกร้องใด ๆ ที่เกิดขึ้นจากหรือเกี่ยวข้องกับการละเมิดคำชี้แจงของข้าพเจ้าในที่นี้
เราทุ่มเทให้กับความเป็นส่วนตัวและความปลอดภัยของข้อมูลส่วนบุคคลของคุณ เรารวบรวมอีเมลเพื่อมอบข้อเสนอพิเศษและข้อมูลสำคัญเกี่ยวกับผลิตภัณฑ์และบริการของเราเท่านั้น โดยการมอบที่อยู่อีเมลของคุณ คุณตกลงที่จะรับจดหมายดังกล่าวจากเรา หากคุณต้องการบอกเลิกการรับจดหมายหรือมีคำถามหรือข้อสงสัยใด ๆ กรุณาส่งไปที่ฝ่ายบริการลูกค้าของเรา
Octa trading broker
เปิดบัญชีการเทรด
Back

USD/INR Technical Analysis: 100-day MA is key resistance

The USD/INR pair closed at 71.44 on Feb. 1, confirming a bull flag breakout. The 100-day moving average (MA), however, has put the brakes on the post-breakout rally.

Daily chart
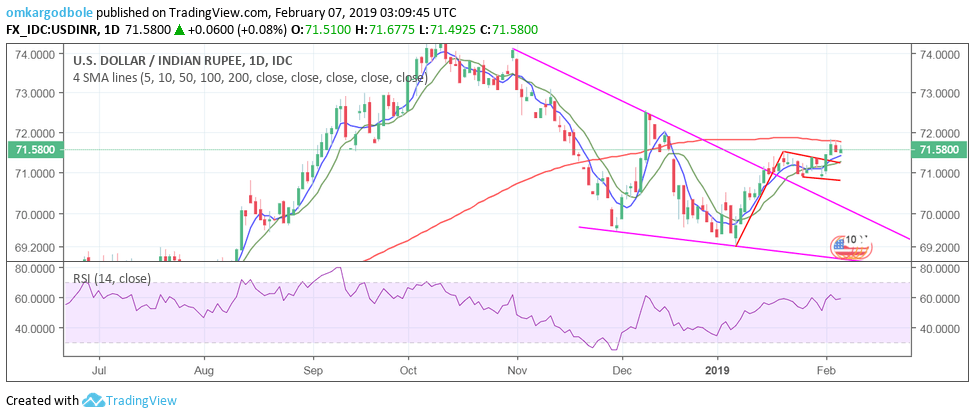
The back-to-back failure to penetrate the 100-day MA on a closing basis is a slight cause for concern. The outlook, however, remains bullish while the pair is held above the former resistance-turned-support of 71.38 (Jan. 29 high).

With 5- and 10-day moving averages (MAs) trending north, dips to 71.38, if any, could be short-lived.

A close above the 100-day MA of 71.78 would bolster the already bullish setup and open up upside toward 72.55. Note that the 14-day RSI is located at 58, meaning there is sufficient room for a convincing move above 72.00.

India' Nifty index has found acceptance above the crucial resistance of 11,000. The stocks, therefore, could remain better bid, providing some support to INR.

Trend: cautiously bullish

USD/INR

Overview:
    Today Last Price: 71.675
    Today Daily change: 0.0950 pips
    Today Daily change %: 0.13%
    Today Daily Open: 71.58
Trends:
    Daily SMA20: 71.1083
    Daily SMA50: 70.7616
    Daily SMA100: 71.7746
    Daily SMA200: 70.352
Levels:
    Previous Daily High: 71.78
    Previous Daily Low: 71.475
    Previous Weekly High: 71.64
    Previous Weekly Low: 70.82
    Previous Monthly High: 71.64
    Previous Monthly Low: 69.185
    Daily Fibonacci 38.2%: 71.6635
    Daily Fibonacci 61.8%: 71.5915
    Daily Pivot Point S1: 71.4433
    Daily Pivot Point S2: 71.3067
    Daily Pivot Point S3: 71.1383
    Daily Pivot Point R1: 71.7483
    Daily Pivot Point R2: 71.9167
    Daily Pivot Point R3: 72.0533


Ex-Fed Chair Yellen: Rate cuts, hikes both possible - WSJ

Former Federal Reserve Chairwoman Janet Yellen said that she lacks clarity on what the next Fed move on rates will be, in an interview with CNBC on We
อ่านเพิ่มเติม Previous

USD/JPY Technical Analysis: Sellers continue to lurk ahead of 110.00

USD/JPY daily chart A horizontal-line connecting August 2018 closing lows to the highs marked during 2019 so far restricts USD/JPY upside around 11
อ่านเพิ่มเติม Next