Confirming you are not from the U.S. or the Philippines

โดยการให้คำชี้แจงนี้ ข้าพเจ้าขอประกาศและยืนยันอย่างชัดเจนว่า:
  • ข้าพเจ้ามิใช่พลเมืองหรือผู้ที่พำนักอาศัยสหรัฐอเมริกา
  • ฉันไม่ใช่ผู้พำนักอาศัยในฟิลิปปินส์
  • ข้าพเจ้าไม่ได้เป็นเจ้าของหุ้น/สิทธิ์ในการออกเสียง/ผลประโยชน์ของผู้พำนักในสหรัฐอเมริกาทั้งทางตรงและทางอ้อมเกินกว่า 10% และ/หรือไม่ได้ควบคุมพลเมืองหรือผู้พำนักในสหรัฐอเมริกาด้วยวิธีการอื่น
  • ข้าพเจ้าไม่ได้อยู่ภายใต้ความเป็นเจ้าของโดยตรงหรือโดยอ้อมมากกว่า 10% ของจำนวนหุ้น/สิทธิในการออกเสียง/ดอกเบี้ยและ/หรืออยู่ภายใต้การควบคุมของพลเมืองสหรัฐอเมริกาหรือผู้พำนักอาศัยโดยใช้วิธีการอื่น
  • ข้าพเจ้าไม่มีส่วนเกี่ยวข้องกับพลเมืองหรือผู้พำนักในสหรัฐอเมริกาตามมาตรา 1504(a) ของ FATCA
  • ข้าพเจ้าตระหนักดีถึงความรับผิดของข้าพเจ้าในการแสดงข้อความอันเป็นเท็จ
สำหรับวัตถุประสงค์ของคำชี้แจงนี้ ประเทศและดินแดนที่อยู่ภายใต้การปกครองของสหรัฐอเมริกาทั้งหมดจะเท่ากับอาณาเขตหลักของสหรัฐอเมริกา ข้าพเจ้าให้คำมั่นที่จะปกป้องและปกป้อง Octa Markets Incorporated กรรมการและเจ้าหน้าที่ของ Octa Markets Incorporated จากการเรียกร้องใด ๆ ที่เกิดขึ้นจากหรือเกี่ยวข้องกับการละเมิดคำชี้แจงของข้าพเจ้าในที่นี้
เราทุ่มเทให้กับความเป็นส่วนตัวและความปลอดภัยของข้อมูลส่วนบุคคลของคุณ เรารวบรวมอีเมลเพื่อมอบข้อเสนอพิเศษและข้อมูลสำคัญเกี่ยวกับผลิตภัณฑ์และบริการของเราเท่านั้น โดยการมอบที่อยู่อีเมลของคุณ คุณตกลงที่จะรับจดหมายดังกล่าวจากเรา หากคุณต้องการบอกเลิกการรับจดหมายหรือมีคำถามหรือข้อสงสัยใด ๆ กรุณาส่งไปที่ฝ่ายบริการลูกค้าของเรา
Octa trading broker
เปิดบัญชีการเทรด
Back

USD/JPY Technical Analysis: Sellers continue to lurk ahead of 110.00

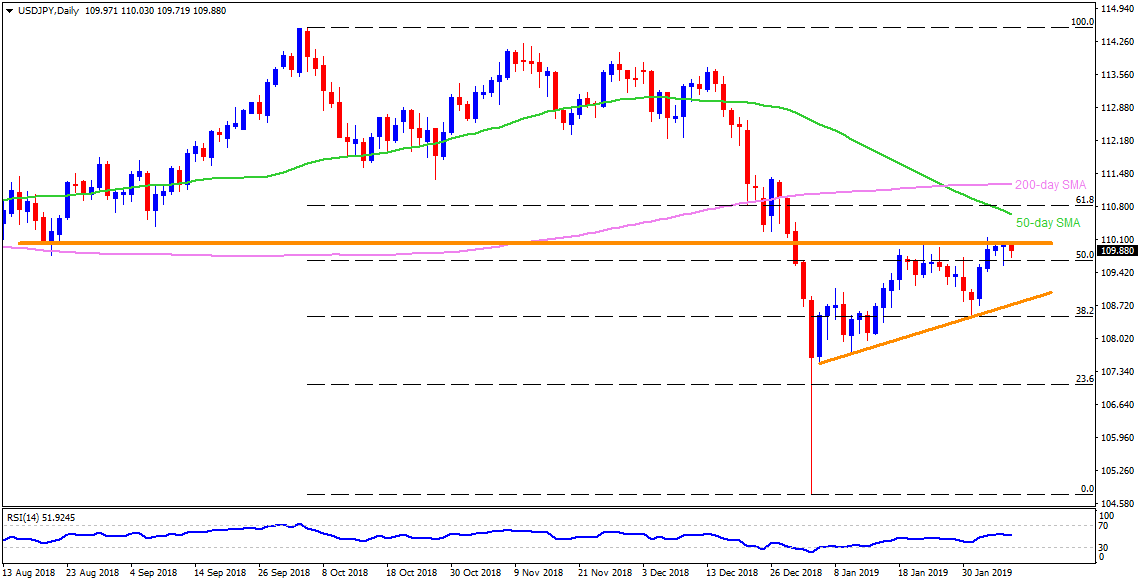
USD/JPY daily chart

  • A horizontal-line connecting August 2018 closing lows to the highs marked during 2019 so far restricts USD/JPY upside around 110.00 on early Thursday.
  • As a result, chances of the pair’s pullback to the 109.10 and then to the 108.70 support-line can’t be denied.
  • On the flip side, a daily closing beyond 110.00 can trigger an upside towards 50-day simple moving average (SMA) level of 110.65 prior to highlighting 111.25, including 200-day SMA, as resistance.
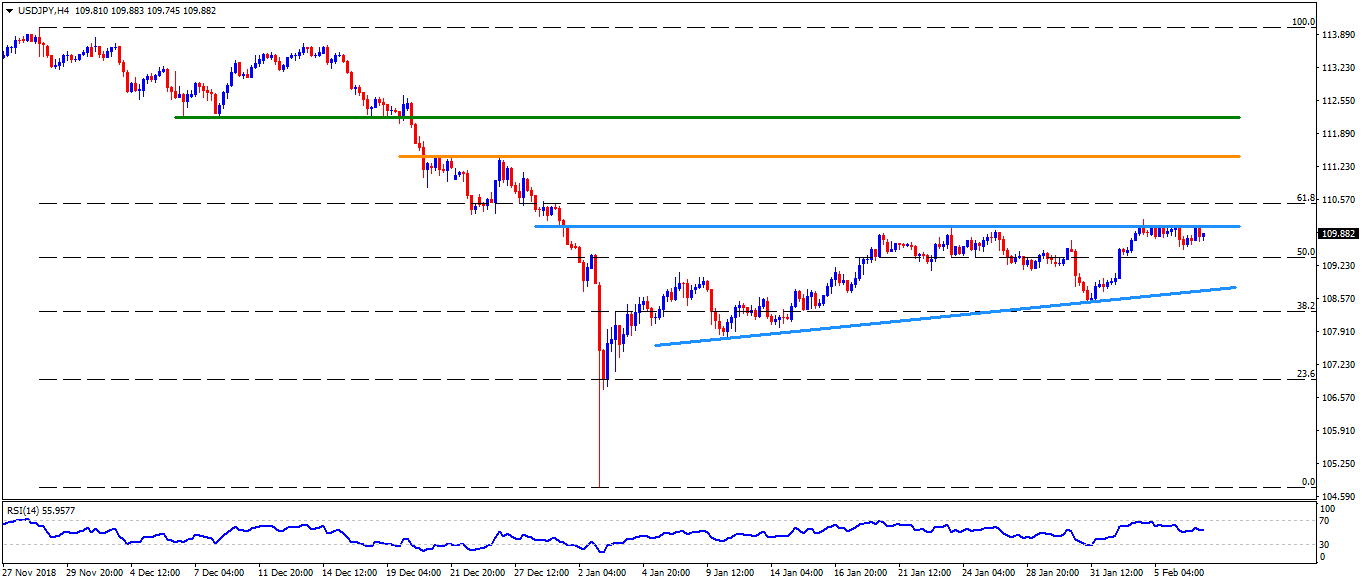
USD/JPY 4-hour chart

  • On the shorter time frame, 109.50 can offer immediate support ahead of shifting focus to the 109.10 and then to the 108.70.
  • If there prevail additional downside pressure after 108.70, then 108.50 and 107.70 could regain market attention.
  • Meanwhile, 61.8% Fibonacci Retracement of its recent declines, around 110.50, acts as adjacent resistance for the pair once it clears the 110.00 barrier.
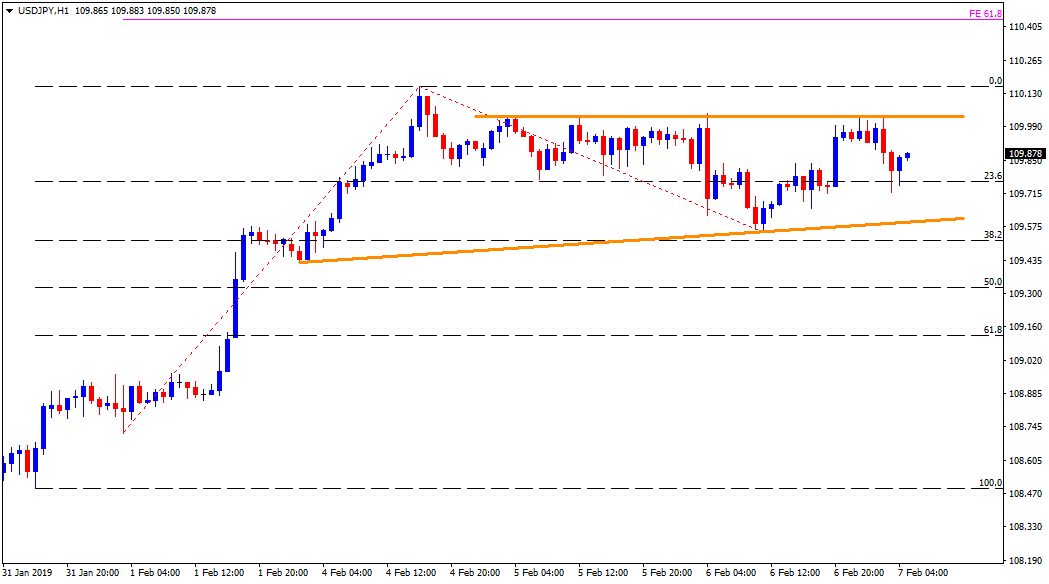
USD/JPY Hourly chart

  • The 109.60 and the 110.00 restricts the pair’s near-term moves with 109.50 and the 110.15 being follow-on levels to observe on either side breaks.
  • The 61.8% Fibonacci expansion on latest pullback, at 110.45 can please buyers after 110.15 while 109.50 and 109.10 seem sellers’ bets past-109.60.
USD/INR Technical Analysis: 100-day MA is key resistance

The USD/INR pair closed at 71.44 on Feb. 1, confirming a bull flag breakout. The 100-day moving average (MA), however, has put the brakes on the post-
อ่านเพิ่มเติม Previous

White House Chief of staff Mulvaney: Will figure out wall if Congress says no - Fox

Acting White House chief of staff Mick Mulvaney is out on the wires reiterating that President Trump will figure out ways to construct a wall across M
อ่านเพิ่มเติม Next