Confirming you are not from the U.S. or the Philippines

โดยการให้คำชี้แจงนี้ ข้าพเจ้าขอประกาศและยืนยันอย่างชัดเจนว่า:
  • ข้าพเจ้ามิใช่พลเมืองหรือผู้ที่พำนักอาศัยสหรัฐอเมริกา
  • ฉันไม่ใช่ผู้พำนักอาศัยในฟิลิปปินส์
  • ข้าพเจ้าไม่ได้เป็นเจ้าของหุ้น/สิทธิ์ในการออกเสียง/ผลประโยชน์ของผู้พำนักในสหรัฐอเมริกาทั้งทางตรงและทางอ้อมเกินกว่า 10% และ/หรือไม่ได้ควบคุมพลเมืองหรือผู้พำนักในสหรัฐอเมริกาด้วยวิธีการอื่น
  • ข้าพเจ้าไม่ได้อยู่ภายใต้ความเป็นเจ้าของโดยตรงหรือโดยอ้อมมากกว่า 10% ของจำนวนหุ้น/สิทธิในการออกเสียง/ดอกเบี้ยและ/หรืออยู่ภายใต้การควบคุมของพลเมืองสหรัฐอเมริกาหรือผู้พำนักอาศัยโดยใช้วิธีการอื่น
  • ข้าพเจ้าไม่มีส่วนเกี่ยวข้องกับพลเมืองหรือผู้พำนักในสหรัฐอเมริกาตามมาตรา 1504(a) ของ FATCA
  • ข้าพเจ้าตระหนักดีถึงความรับผิดของข้าพเจ้าในการแสดงข้อความอันเป็นเท็จ
สำหรับวัตถุประสงค์ของคำชี้แจงนี้ ประเทศและดินแดนที่อยู่ภายใต้การปกครองของสหรัฐอเมริกาทั้งหมดจะเท่ากับอาณาเขตหลักของสหรัฐอเมริกา ข้าพเจ้าให้คำมั่นที่จะปกป้องและปกป้อง Octa Markets Incorporated กรรมการและเจ้าหน้าที่ของ Octa Markets Incorporated จากการเรียกร้องใด ๆ ที่เกิดขึ้นจากหรือเกี่ยวข้องกับการละเมิดคำชี้แจงของข้าพเจ้าในที่นี้
เราทุ่มเทให้กับความเป็นส่วนตัวและความปลอดภัยของข้อมูลส่วนบุคคลของคุณ เรารวบรวมอีเมลเพื่อมอบข้อเสนอพิเศษและข้อมูลสำคัญเกี่ยวกับผลิตภัณฑ์และบริการของเราเท่านั้น โดยการมอบที่อยู่อีเมลของคุณ คุณตกลงที่จะรับจดหมายดังกล่าวจากเรา หากคุณต้องการบอกเลิกการรับจดหมายหรือมีคำถามหรือข้อสงสัยใด ๆ กรุณาส่งไปที่ฝ่ายบริการลูกค้าของเรา
Octa trading broker
เปิดบัญชีการเทรด
Back

WTI Technical Analysis: “Rising Wedge” breakout in place, initially targeting $51.10

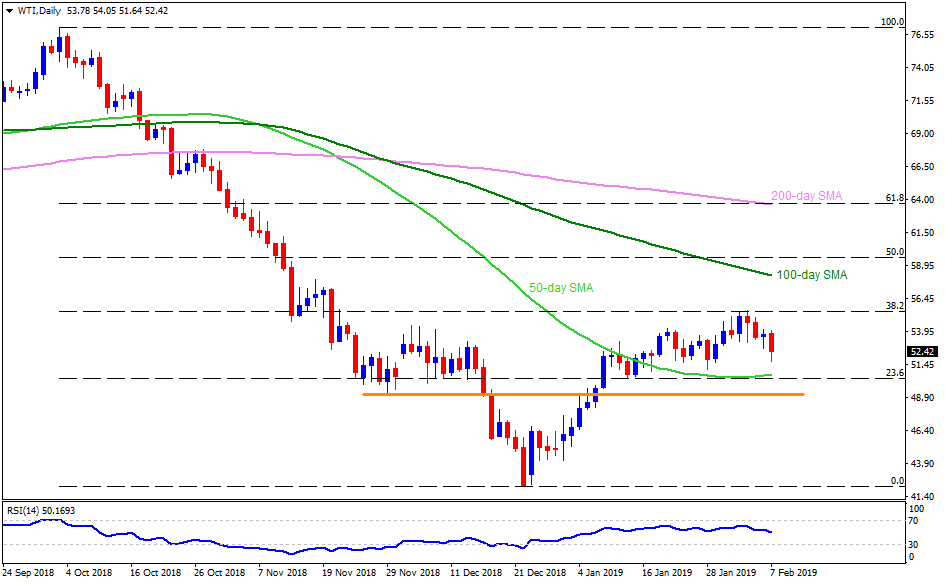
WTI daily chart

  • Failure to surpass 38.2% Fibonacci Retracement of its October to December 2018 downturn highlights the importance of two-week low of $51.10, breaking which 50-day simple moving average (SMA) figure of $50.60 can gain market attention.
  • In case prices refrain to respect $50.60 level, the $50.00 mark and the $49.10-$49.00 horizontal-area may become next support to watch.
  • On the upside, a closing break of $55.45, comprising 38.2% Fibonacci, could accelerate the upmoves to 100-day SMA level of $58.20.

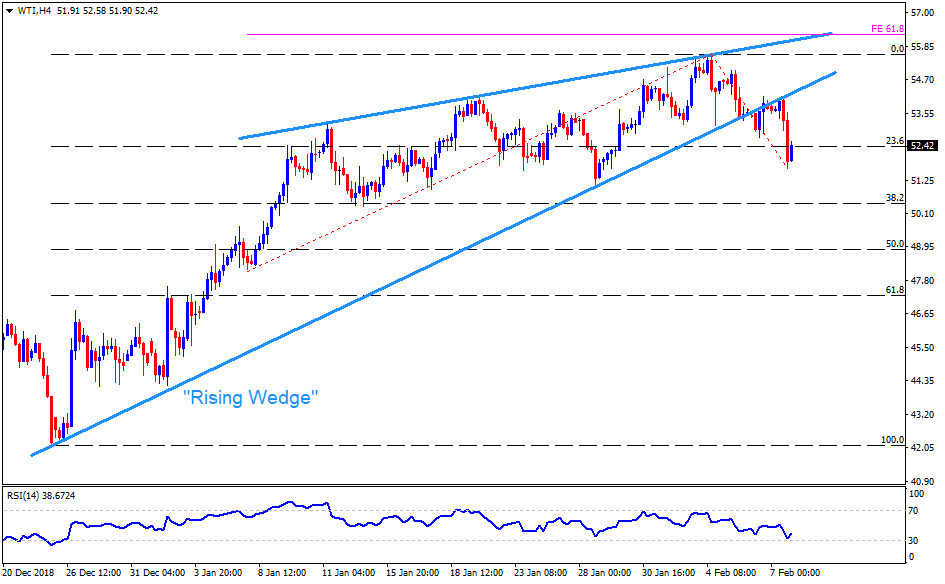
WTI 4-hour chart

  • “Rising Wedge” break signals further declines of the WTI.
  • It can take rest at $51.10 initially to confirm further declines to $50.60 and the $50.30 supports.
  • Alternatively, $54.15 and $55.00 are likely nearby resistances to watch before highlighting $55.45 upside barrier.

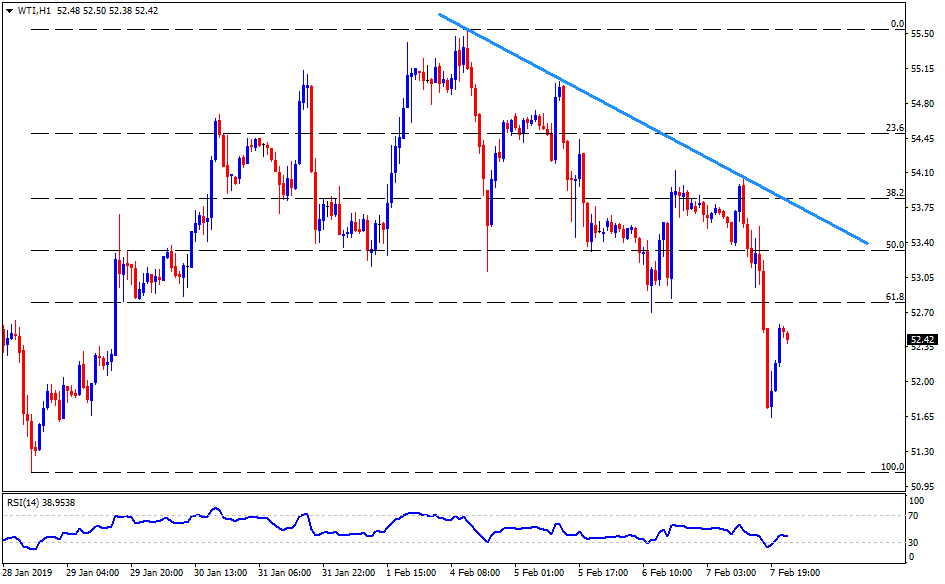
WTI Hourly chart

  • Inability to sustain recent pullback past-$52.60 portrays the weakness.
  • $51.60 becomes a small halt prior to visiting the low of $51.10.
  • Meanwhile, a break of $52.60 can have $53.15 and a downward sloping trend-line at $53.85 as nearby resistances to watch.

NZD/USD steadies near 0.6750, looks to close in red for second straight day

After losing more than 100 pips following the disappointing labour market data from New Zealand, which showed that the unemployment rate rose to 4.3%
อ่านเพิ่มเติม Previous

US Dollar Index Technical Analysis: 96.70 is the level to beat for DXY bulls

DXY daily chart The US Dollar Index (DXY) is trading in a bull trend above its main simple moving averages (SMAs).  DXY 4-hour chart DXY is
อ่านเพิ่มเติม Next