Confirming you are not from the U.S. or the Philippines

โดยการให้คำชี้แจงนี้ ข้าพเจ้าขอประกาศและยืนยันอย่างชัดเจนว่า:
  • ข้าพเจ้ามิใช่พลเมืองหรือผู้ที่พำนักอาศัยสหรัฐอเมริกา
  • ฉันไม่ใช่ผู้พำนักอาศัยในฟิลิปปินส์
  • ข้าพเจ้าไม่ได้เป็นเจ้าของหุ้น/สิทธิ์ในการออกเสียง/ผลประโยชน์ของผู้พำนักในสหรัฐอเมริกาทั้งทางตรงและทางอ้อมเกินกว่า 10% และ/หรือไม่ได้ควบคุมพลเมืองหรือผู้พำนักในสหรัฐอเมริกาด้วยวิธีการอื่น
  • ข้าพเจ้าไม่ได้อยู่ภายใต้ความเป็นเจ้าของโดยตรงหรือโดยอ้อมมากกว่า 10% ของจำนวนหุ้น/สิทธิในการออกเสียง/ดอกเบี้ยและ/หรืออยู่ภายใต้การควบคุมของพลเมืองสหรัฐอเมริกาหรือผู้พำนักอาศัยโดยใช้วิธีการอื่น
  • ข้าพเจ้าไม่มีส่วนเกี่ยวข้องกับพลเมืองหรือผู้พำนักในสหรัฐอเมริกาตามมาตรา 1504(a) ของ FATCA
  • ข้าพเจ้าตระหนักดีถึงความรับผิดของข้าพเจ้าในการแสดงข้อความอันเป็นเท็จ
สำหรับวัตถุประสงค์ของคำชี้แจงนี้ ประเทศและดินแดนที่อยู่ภายใต้การปกครองของสหรัฐอเมริกาทั้งหมดจะเท่ากับอาณาเขตหลักของสหรัฐอเมริกา ข้าพเจ้าให้คำมั่นที่จะปกป้องและปกป้อง Octa Markets Incorporated กรรมการและเจ้าหน้าที่ของ Octa Markets Incorporated จากการเรียกร้องใด ๆ ที่เกิดขึ้นจากหรือเกี่ยวข้องกับการละเมิดคำชี้แจงของข้าพเจ้าในที่นี้
เราทุ่มเทให้กับความเป็นส่วนตัวและความปลอดภัยของข้อมูลส่วนบุคคลของคุณ เรารวบรวมอีเมลเพื่อมอบข้อเสนอพิเศษและข้อมูลสำคัญเกี่ยวกับผลิตภัณฑ์และบริการของเราเท่านั้น โดยการมอบที่อยู่อีเมลของคุณ คุณตกลงที่จะรับจดหมายดังกล่าวจากเรา หากคุณต้องการบอกเลิกการรับจดหมายหรือมีคำถามหรือข้อสงสัยใด ๆ กรุณาส่งไปที่ฝ่ายบริการลูกค้าของเรา
Octa trading broker
เปิดบัญชีการเทรด
Back

AUD/JPY Technical Analysis: 79.80/90 - a tough nut to crack
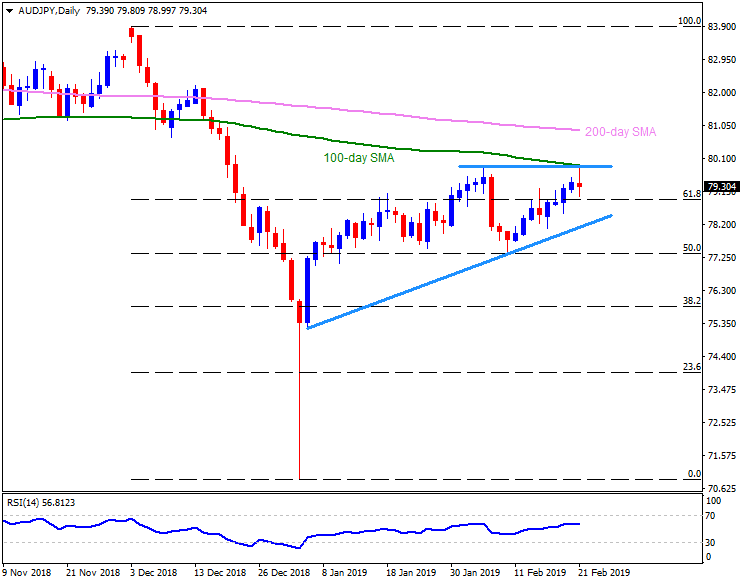
AUD/JPY daily chart

  • AUD/JPY trades near 79.30 during early Thursday.
  • The pair witnessed pullback from the 79.80-90 region, comprising 100-day simple moving average (SMA) and early month high.
  • Buyers need to conquer the 79.90 in order to aim for 200-day SMA level of 80.90 and then 82.20 numbers.
  • In case sellers manage to rule, 61.8% Fibonacci retracement of December to January decline, at 78.90 can become their immediate favorite.
  • Though, an upward sloping trend-line at 78.10, may challenge the downturn, if not then 50% Fibonacci around 77.50 may mark its presence on the chart.

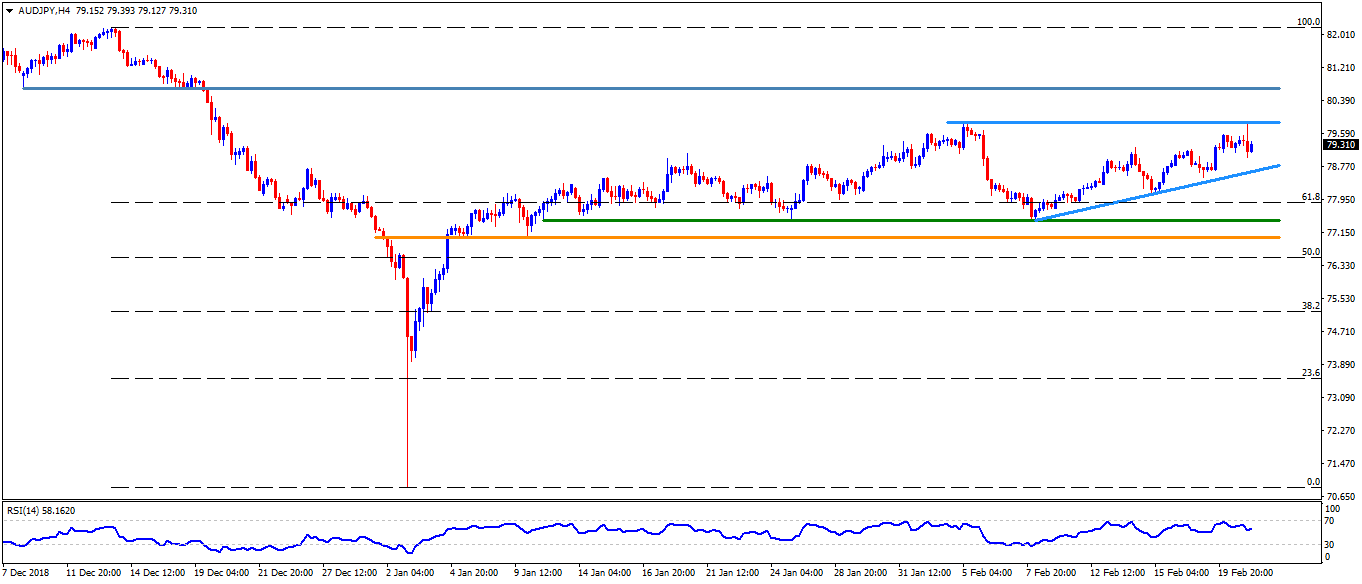
AUD/JPY 4-Hour chart

  • On H4 chart, the 80.70 can offer an intermediate halt to the pair’s rise past-79.90 whereas 81.20 and 81.65 can please the bulls ahead of 82.20.
  • Alternatively, adjacent support-line at 78.55 may offer nearby rest to the pair between 78.90 and 78.10 while 77.50 and 77.00 could flash on sellers radar afterward.

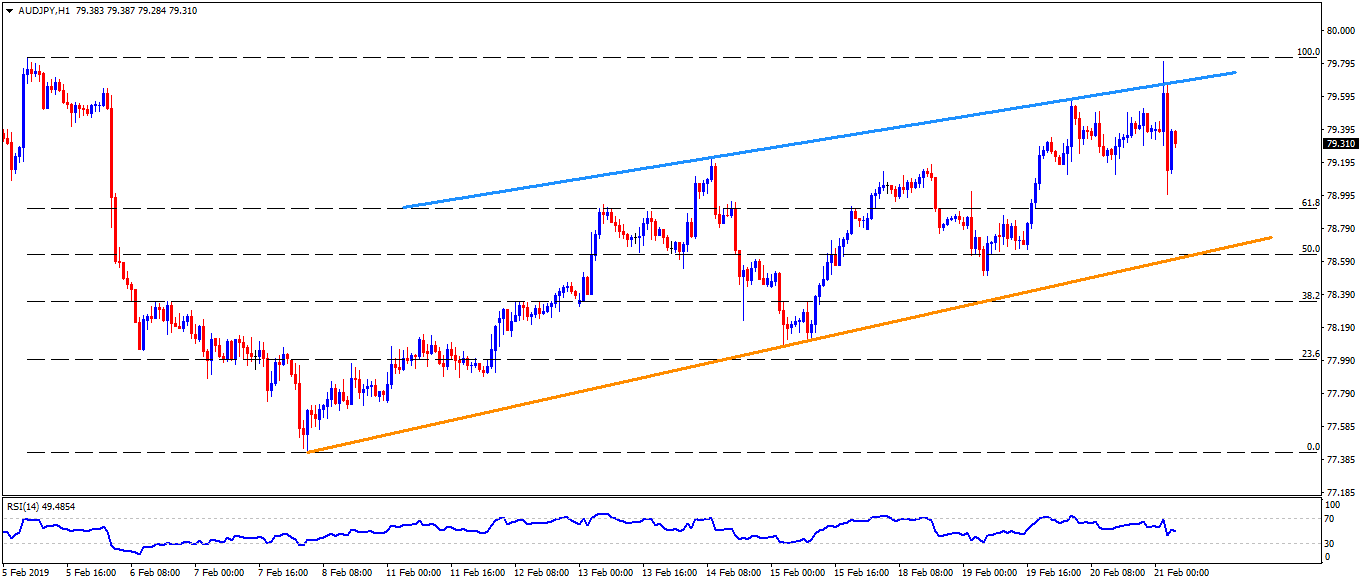
AUD/JPY hourly chart

  • An ascending trend-line connecting high marked on February 14 and 20, at 79.70, may become immediate resistance for the pair ahead of highlighting the 79.80-90 area.
  • Meanwhile 61.8% Fibonacci retracement of its decline during the first week of the month, at 78.90 and an upward sloping trend-line, at 78.55, might act as adjacent supports for the pair.

Gold Technical Analysis: Pullback to ascending 5-day MA likely

Gold is currently trading at $1,340, having clocked a high of $1,346.85 yesterday.  On the daily chart, the safe haven yellow metal carved out a doji
อ่านเพิ่มเติม Previous

USD/INR Technical Analysis: 100-day MA is again reversing bounce

USD/INR is currently trading at 71.00, having failed to take out the 100-day moving average (MA)  in the previous two days.  Daily chart As seen a
อ่านเพิ่มเติม Next