Confirming you are not from the U.S. or the Philippines

โดยการให้คำชี้แจงนี้ ข้าพเจ้าขอประกาศและยืนยันอย่างชัดเจนว่า:
  • ข้าพเจ้ามิใช่พลเมืองหรือผู้ที่พำนักอาศัยสหรัฐอเมริกา
  • ฉันไม่ใช่ผู้พำนักอาศัยในฟิลิปปินส์
  • ข้าพเจ้าไม่ได้เป็นเจ้าของหุ้น/สิทธิ์ในการออกเสียง/ผลประโยชน์ของผู้พำนักในสหรัฐอเมริกาทั้งทางตรงและทางอ้อมเกินกว่า 10% และ/หรือไม่ได้ควบคุมพลเมืองหรือผู้พำนักในสหรัฐอเมริกาด้วยวิธีการอื่น
  • ข้าพเจ้าไม่ได้อยู่ภายใต้ความเป็นเจ้าของโดยตรงหรือโดยอ้อมมากกว่า 10% ของจำนวนหุ้น/สิทธิในการออกเสียง/ดอกเบี้ยและ/หรืออยู่ภายใต้การควบคุมของพลเมืองสหรัฐอเมริกาหรือผู้พำนักอาศัยโดยใช้วิธีการอื่น
  • ข้าพเจ้าไม่มีส่วนเกี่ยวข้องกับพลเมืองหรือผู้พำนักในสหรัฐอเมริกาตามมาตรา 1504(a) ของ FATCA
  • ข้าพเจ้าตระหนักดีถึงความรับผิดของข้าพเจ้าในการแสดงข้อความอันเป็นเท็จ
สำหรับวัตถุประสงค์ของคำชี้แจงนี้ ประเทศและดินแดนที่อยู่ภายใต้การปกครองของสหรัฐอเมริกาทั้งหมดจะเท่ากับอาณาเขตหลักของสหรัฐอเมริกา ข้าพเจ้าให้คำมั่นที่จะปกป้องและปกป้อง Octa Markets Incorporated กรรมการและเจ้าหน้าที่ของ Octa Markets Incorporated จากการเรียกร้องใด ๆ ที่เกิดขึ้นจากหรือเกี่ยวข้องกับการละเมิดคำชี้แจงของข้าพเจ้าในที่นี้
เราทุ่มเทให้กับความเป็นส่วนตัวและความปลอดภัยของข้อมูลส่วนบุคคลของคุณ เรารวบรวมอีเมลเพื่อมอบข้อเสนอพิเศษและข้อมูลสำคัญเกี่ยวกับผลิตภัณฑ์และบริการของเราเท่านั้น โดยการมอบที่อยู่อีเมลของคุณ คุณตกลงที่จะรับจดหมายดังกล่าวจากเรา หากคุณต้องการบอกเลิกการรับจดหมายหรือมีคำถามหรือข้อสงสัยใด ๆ กรุณาส่งไปที่ฝ่ายบริการลูกค้าของเรา
Back

GBP/USD technical analysis: Tests long-term falling wedge support amid oversold RSI

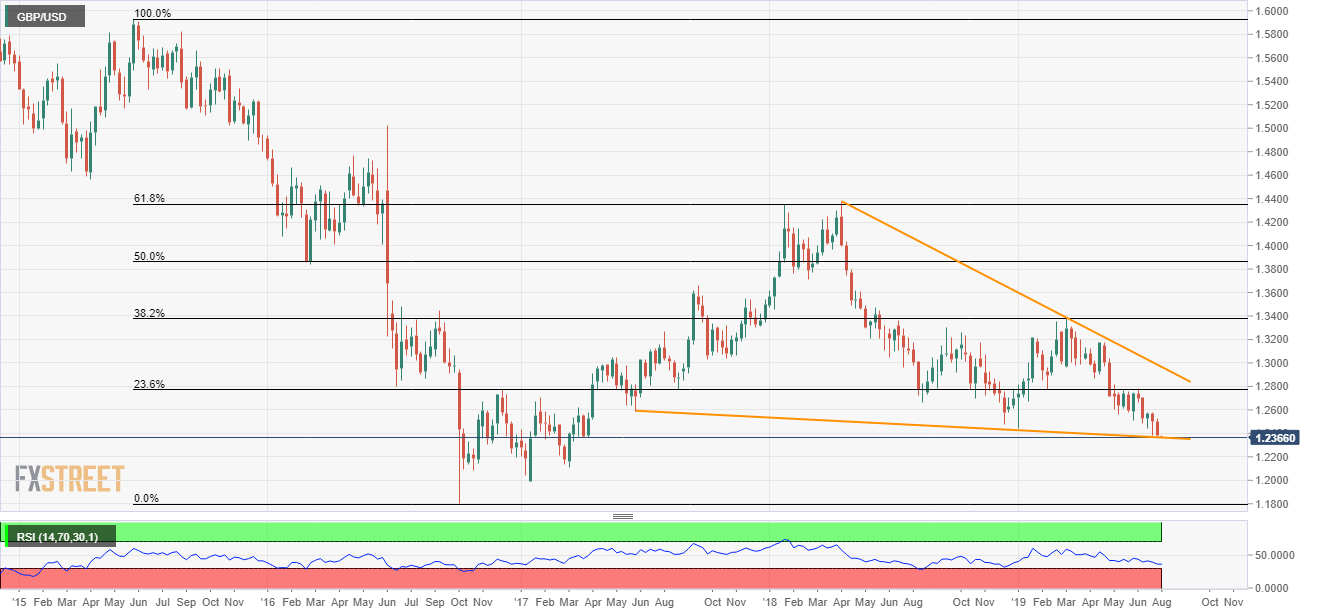
  • 25-month old descending trend-line, forming part of a falling wedge, can limit GBP/USD declines amid oversold RSI conditions.
  • 1.2580, 23.6% Fibonacci retracement limit immediate advances.

Despite falling to the lowest since early 2017, the GBP/USD’s further declines seem confined as it takes the rounds to 1.2365 while heading into the UK open on Monday.

A downward sloping trend-line since June 2017, at 1.2363 now, offers key immediate support for the pair, a break of which can defy the long-term bullish formation and can further please bears with March 2017 low around 1.2110.

Also challenging the declines is oversold conditions of 14-day relative strength index (RSI).

On the upside, the quote should successfully overcome mid-month tops close to 1.2580 in order to push buyers towards 23.6% Fibonacci retracement of 2015 swing high to 2016 swing low, at 1.2773.

GBP/USD weekly chart
Trend: Bearish


GBP/USD remains negative below 1.2515 – Commerzbank

Karen Jones, Team Head FICC Technical Analysis Research, noted the very near term outlook on Cable stays neutral to negative while below 1.2515. Key Q
อ่านเพิ่มเติม Previous

South Africa Private Sector Credit came in at 6.91% below forecasts (8%) in June

South Africa Private Sector Credit came in at 6.91% below forecasts (8%) in June
อ่านเพิ่มเติม Next