Confirming you are not from the U.S. or the Philippines

โดยการให้คำชี้แจงนี้ ข้าพเจ้าขอประกาศและยืนยันอย่างชัดเจนว่า:
  • ข้าพเจ้ามิใช่พลเมืองหรือผู้ที่พำนักอาศัยสหรัฐอเมริกา
  • ฉันไม่ใช่ผู้พำนักอาศัยในฟิลิปปินส์
  • ข้าพเจ้าไม่ได้เป็นเจ้าของหุ้น/สิทธิ์ในการออกเสียง/ผลประโยชน์ของผู้พำนักในสหรัฐอเมริกาทั้งทางตรงและทางอ้อมเกินกว่า 10% และ/หรือไม่ได้ควบคุมพลเมืองหรือผู้พำนักในสหรัฐอเมริกาด้วยวิธีการอื่น
  • ข้าพเจ้าไม่ได้อยู่ภายใต้ความเป็นเจ้าของโดยตรงหรือโดยอ้อมมากกว่า 10% ของจำนวนหุ้น/สิทธิในการออกเสียง/ดอกเบี้ยและ/หรืออยู่ภายใต้การควบคุมของพลเมืองสหรัฐอเมริกาหรือผู้พำนักอาศัยโดยใช้วิธีการอื่น
  • ข้าพเจ้าไม่มีส่วนเกี่ยวข้องกับพลเมืองหรือผู้พำนักในสหรัฐอเมริกาตามมาตรา 1504(a) ของ FATCA
  • ข้าพเจ้าตระหนักดีถึงความรับผิดของข้าพเจ้าในการแสดงข้อความอันเป็นเท็จ
สำหรับวัตถุประสงค์ของคำชี้แจงนี้ ประเทศและดินแดนที่อยู่ภายใต้การปกครองของสหรัฐอเมริกาทั้งหมดจะเท่ากับอาณาเขตหลักของสหรัฐอเมริกา ข้าพเจ้าให้คำมั่นที่จะปกป้องและปกป้อง Octa Markets Incorporated กรรมการและเจ้าหน้าที่ของ Octa Markets Incorporated จากการเรียกร้องใด ๆ ที่เกิดขึ้นจากหรือเกี่ยวข้องกับการละเมิดคำชี้แจงของข้าพเจ้าในที่นี้
เราทุ่มเทให้กับความเป็นส่วนตัวและความปลอดภัยของข้อมูลส่วนบุคคลของคุณ เรารวบรวมอีเมลเพื่อมอบข้อเสนอพิเศษและข้อมูลสำคัญเกี่ยวกับผลิตภัณฑ์และบริการของเราเท่านั้น โดยการมอบที่อยู่อีเมลของคุณ คุณตกลงที่จะรับจดหมายดังกล่าวจากเรา หากคุณต้องการบอกเลิกการรับจดหมายหรือมีคำถามหรือข้อสงสัยใด ๆ กรุณาส่งไปที่ฝ่ายบริการลูกค้าของเรา
Octa trading broker
เปิดบัญชีการเทรด
Back

USD/CNH technical analysis: 21-day EMA holds the key to 7.1390/1400 horizontal resistance

  • USD/CNH has been trading below 21-day EMA for the last four days.
  • 23.6% Fibonacci retracement offers immediate support ahead of 50-day EMA and five-month-old rising trend-line.

Despite successfully trading beyond 23.6% Fibonacci retracement of March-September upside, USD/CNH stays below the 21-day exponential moving average (EMA) as it makes the rounds to 7.0850 during early Wednesday.

The quote needs to provide a daily closing beyond 21-day EMA level of 7.0950 in order to aim for 7.1390/1400 horizontal area including multiple highs/lows marked during August.

Should prices successfully rise beyond 7.1400, monthly top close to 7.1970 and 7.2000 will be on the bulls’ radar.

Meanwhile, the pair’s break below 23.6% Fibonacci retracement level of 7.0725 can take rest on 50-day EMA, at 7.0457 now. However, 38.2% Fibonacci retracement level of 6.9957 and an upward sloping trend-line since April near 6.9644 could question sellers afterward.
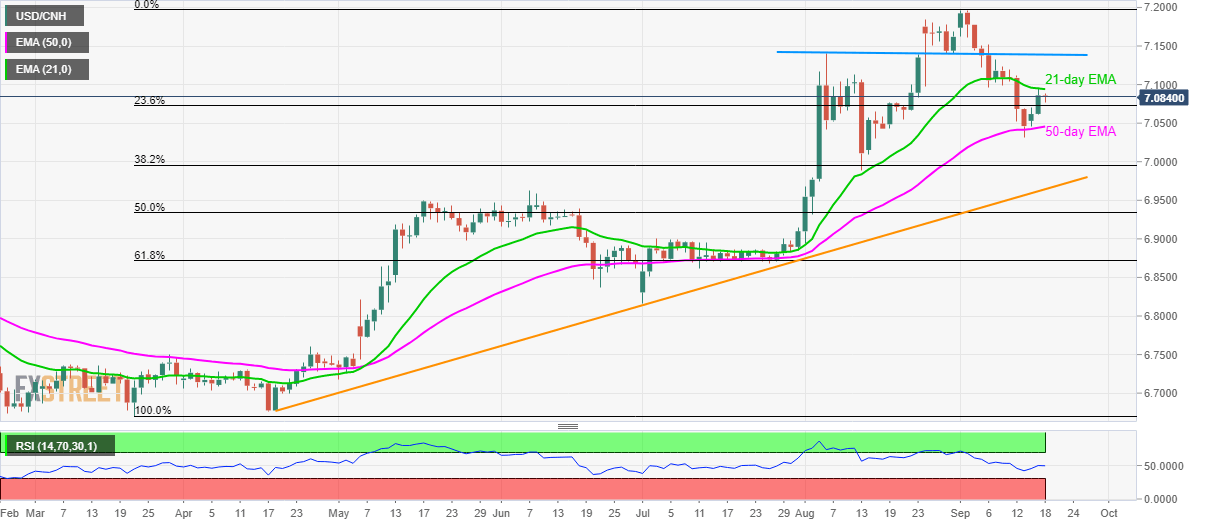
USD/CNH daily chart

Trend: bullish


Silver technical analysis: Bulls and bears about to lock heads around 38.2% and 50% Fibo's

Technically, resting on the 50% and 38.2% Fibonacci lines of the mid-July to recent Sep highs, Silver has moved higher from the trendline support and
อ่านเพิ่มเติม Previous

EUR/JPY technical analysis: Breaching 5-month falling trendline

EUR/JPY is currently trading just above 119.64 – the resistance of the trendline connecting April 17 and July 1 highs. A convincing close above 119.64
อ่านเพิ่มเติม Next