Confirming you are not from the U.S. or the Philippines

โดยการให้คำชี้แจงนี้ ข้าพเจ้าขอประกาศและยืนยันอย่างชัดเจนว่า:
  • ข้าพเจ้ามิใช่พลเมืองหรือผู้ที่พำนักอาศัยสหรัฐอเมริกา
  • ฉันไม่ใช่ผู้พำนักอาศัยในฟิลิปปินส์
  • ข้าพเจ้าไม่ได้เป็นเจ้าของหุ้น/สิทธิ์ในการออกเสียง/ผลประโยชน์ของผู้พำนักในสหรัฐอเมริกาทั้งทางตรงและทางอ้อมเกินกว่า 10% และ/หรือไม่ได้ควบคุมพลเมืองหรือผู้พำนักในสหรัฐอเมริกาด้วยวิธีการอื่น
  • ข้าพเจ้าไม่ได้อยู่ภายใต้ความเป็นเจ้าของโดยตรงหรือโดยอ้อมมากกว่า 10% ของจำนวนหุ้น/สิทธิในการออกเสียง/ดอกเบี้ยและ/หรืออยู่ภายใต้การควบคุมของพลเมืองสหรัฐอเมริกาหรือผู้พำนักอาศัยโดยใช้วิธีการอื่น
  • ข้าพเจ้าไม่มีส่วนเกี่ยวข้องกับพลเมืองหรือผู้พำนักในสหรัฐอเมริกาตามมาตรา 1504(a) ของ FATCA
  • ข้าพเจ้าตระหนักดีถึงความรับผิดของข้าพเจ้าในการแสดงข้อความอันเป็นเท็จ
สำหรับวัตถุประสงค์ของคำชี้แจงนี้ ประเทศและดินแดนที่อยู่ภายใต้การปกครองของสหรัฐอเมริกาทั้งหมดจะเท่ากับอาณาเขตหลักของสหรัฐอเมริกา ข้าพเจ้าให้คำมั่นที่จะปกป้องและปกป้อง Octa Markets Incorporated กรรมการและเจ้าหน้าที่ของ Octa Markets Incorporated จากการเรียกร้องใด ๆ ที่เกิดขึ้นจากหรือเกี่ยวข้องกับการละเมิดคำชี้แจงของข้าพเจ้าในที่นี้
เราทุ่มเทให้กับความเป็นส่วนตัวและความปลอดภัยของข้อมูลส่วนบุคคลของคุณ เรารวบรวมอีเมลเพื่อมอบข้อเสนอพิเศษและข้อมูลสำคัญเกี่ยวกับผลิตภัณฑ์และบริการของเราเท่านั้น โดยการมอบที่อยู่อีเมลของคุณ คุณตกลงที่จะรับจดหมายดังกล่าวจากเรา หากคุณต้องการบอกเลิกการรับจดหมายหรือมีคำถามหรือข้อสงสัยใด ๆ กรุณาส่งไปที่ฝ่ายบริการลูกค้าของเรา
Octa trading broker
เปิดบัญชีการเทรด
Back

AUD/JPY technical analysis: 100-day SMA, 61.8% Fibo. challenge latest recovery

  • AUD/JPY bounces off a multi-week long falling trendline.
  • 100-day SMA, 61.8% Fibonacci retracement question buyers amid bullish MACD.

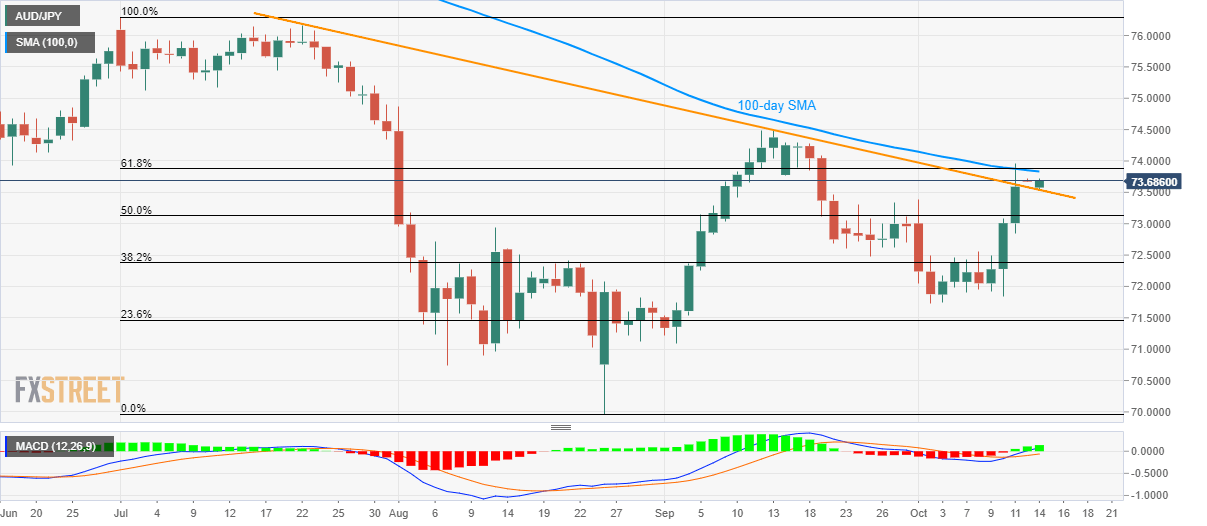
Despite taking a U-turn from resistance-turned-support, the AUD/JPY pair is yet to clear near-term key resistance-confluence as it takes the bids to 73.70 during early Monday morning in Asia.

The pair respects bullish signal of 12-bar Moving Average Convergence and Divergence (MACD) while bouncing off a downward-sloping trend-line since late-July. However, bulls need a confirmation as 73.83/88 resistance area, comprising 100-day Simple Moving Average (SMA) and 61.8% Fibonacci retracement of July-August downpour, remains untouched.

Should prices rally beyond 73.88 on a daily closing basis, September month high near 74.50 becomes buyers’ favorite whereas early-July lows close to 75.10/20 could question further upside.

Alternatively, pair’s declines below the resistance-turned-support line of 73.58 highlight 50% Fibonacci retracement level of 73.13 as following rest.

In a case where the pullback lasts longer below 73.13, 72.50 and monthly bottoms around 71.70 could lure bears.

AUD/JPY daily chart
Trend: pullback expected


USD/JPY consolidating bull rally into 108 handle on US/Sino trade deal optimism

USD/JPY starts out the week flat to Friday's close after markets rallied at the end of the week. The prospects of a full-on trade deal between the US
อ่านเพิ่มเติม Previous

Gold sellers cheer US-China trade optimism against all odds

With the US and China near to end the two-year-old trade tussle, Gold bears give little importance to doubts over soft Brexit and tension surrounding Syria.
อ่านเพิ่มเติม Next