Back
9 Jan 2020
GBP/USD Price Analysis: Pound under pressure, approaching the 1.3000 handle
- GBP/USD is breaking down from a triangle pattern.
- The level to beat for sellers is the 1.3000 handle.
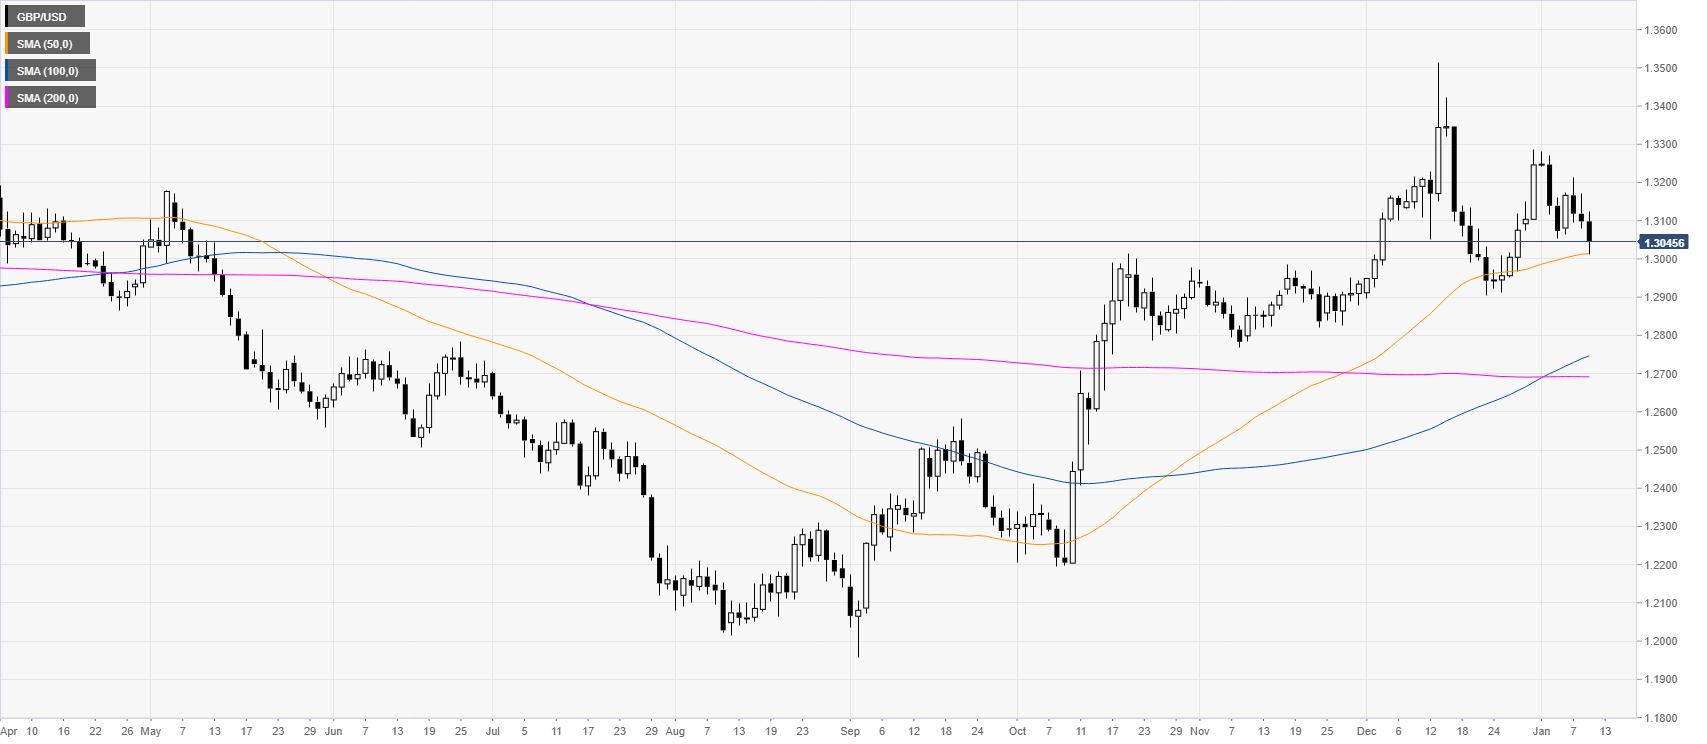
GBP/USD daily chart
GBP/USD is breaking down from a triangle pattern while above its main daily simple moving averages (SMAs). The year 2020 kicked off with a potential lower high just below the 1.3300 handle.
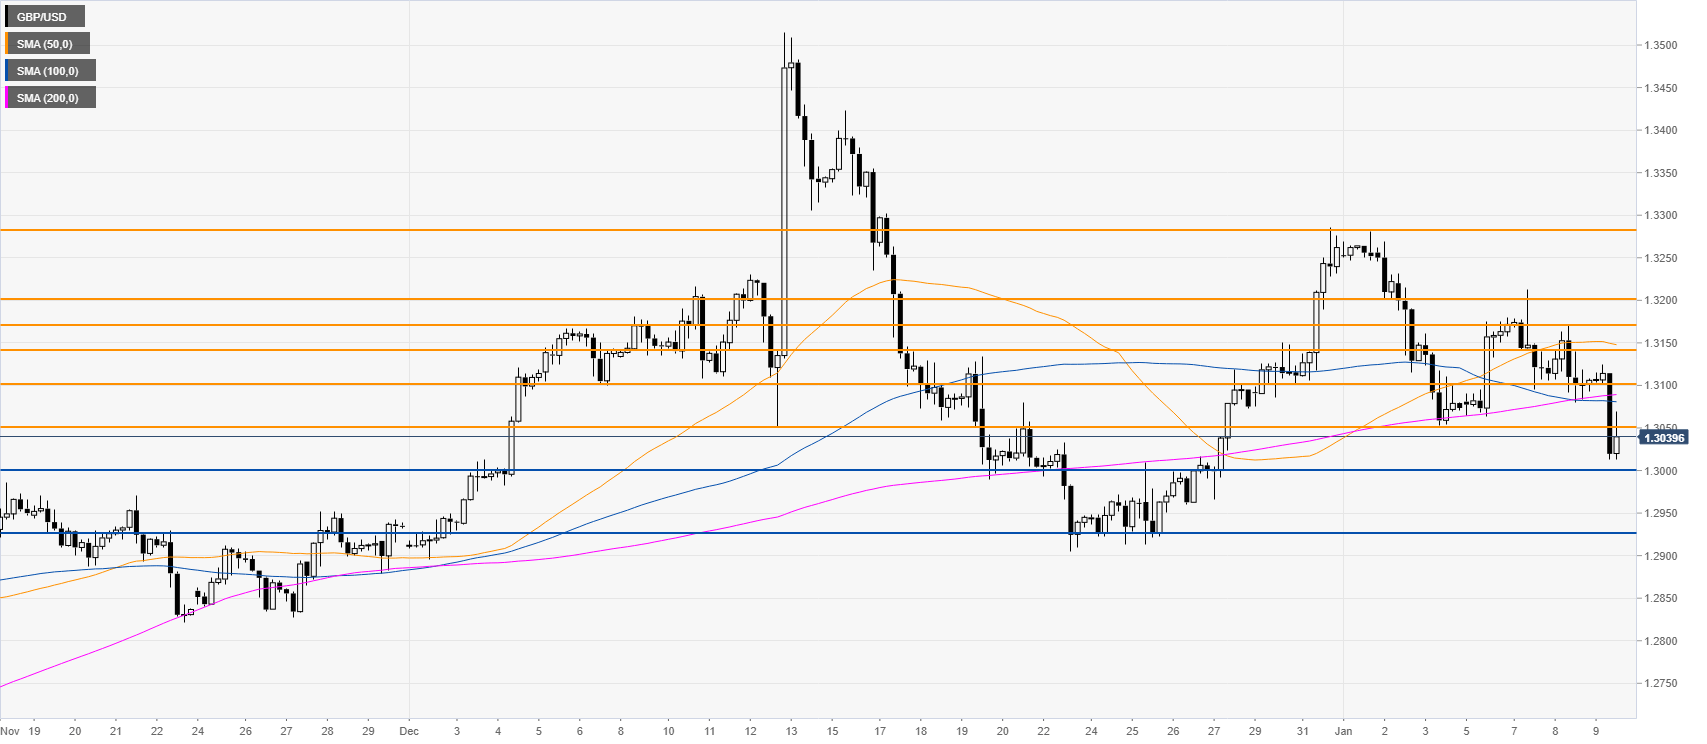
GBP/USD four-hour chart
The pound had a bearish leg down below the main SMAs as the bears remain in control. A brek below the 1.3000 figure can lead to further losses towards the 1.2926. Resistance is seen at the 1.3050, 1.3100 and 1.3114 level, according to the Technical Confluences Indicator.
Additional key levels