Confirming you are not from the U.S. or the Philippines

โดยการให้คำชี้แจงนี้ ข้าพเจ้าขอประกาศและยืนยันอย่างชัดเจนว่า:
  • ข้าพเจ้ามิใช่พลเมืองหรือผู้ที่พำนักอาศัยสหรัฐอเมริกา
  • ฉันไม่ใช่ผู้พำนักอาศัยในฟิลิปปินส์
  • ข้าพเจ้าไม่ได้เป็นเจ้าของหุ้น/สิทธิ์ในการออกเสียง/ผลประโยชน์ของผู้พำนักในสหรัฐอเมริกาทั้งทางตรงและทางอ้อมเกินกว่า 10% และ/หรือไม่ได้ควบคุมพลเมืองหรือผู้พำนักในสหรัฐอเมริกาด้วยวิธีการอื่น
  • ข้าพเจ้าไม่ได้อยู่ภายใต้ความเป็นเจ้าของโดยตรงหรือโดยอ้อมมากกว่า 10% ของจำนวนหุ้น/สิทธิในการออกเสียง/ดอกเบี้ยและ/หรืออยู่ภายใต้การควบคุมของพลเมืองสหรัฐอเมริกาหรือผู้พำนักอาศัยโดยใช้วิธีการอื่น
  • ข้าพเจ้าไม่มีส่วนเกี่ยวข้องกับพลเมืองหรือผู้พำนักในสหรัฐอเมริกาตามมาตรา 1504(a) ของ FATCA
  • ข้าพเจ้าตระหนักดีถึงความรับผิดของข้าพเจ้าในการแสดงข้อความอันเป็นเท็จ
สำหรับวัตถุประสงค์ของคำชี้แจงนี้ ประเทศและดินแดนที่อยู่ภายใต้การปกครองของสหรัฐอเมริกาทั้งหมดจะเท่ากับอาณาเขตหลักของสหรัฐอเมริกา ข้าพเจ้าให้คำมั่นที่จะปกป้องและปกป้อง Octa Markets Incorporated กรรมการและเจ้าหน้าที่ของ Octa Markets Incorporated จากการเรียกร้องใด ๆ ที่เกิดขึ้นจากหรือเกี่ยวข้องกับการละเมิดคำชี้แจงของข้าพเจ้าในที่นี้
เราทุ่มเทให้กับความเป็นส่วนตัวและความปลอดภัยของข้อมูลส่วนบุคคลของคุณ เรารวบรวมอีเมลเพื่อมอบข้อเสนอพิเศษและข้อมูลสำคัญเกี่ยวกับผลิตภัณฑ์และบริการของเราเท่านั้น โดยการมอบที่อยู่อีเมลของคุณ คุณตกลงที่จะรับจดหมายดังกล่าวจากเรา หากคุณต้องการบอกเลิกการรับจดหมายหรือมีคำถามหรือข้อสงสัยใด ๆ กรุณาส่งไปที่ฝ่ายบริการลูกค้าของเรา
Octa trading broker
เปิดบัญชีการเทรด
Back

USD/INR Technical Analysis: 100-day EMA checks sellers near three-week low

  • USD/INR extends losses to the third day in a row.
  • 23.6% Fibonacci retracement, 200-day EMA act as additional supports.
  • Buyers will look for entry beyond 61.8% Fibonacci retracement.

USD/INR declines to 71.12, after printing the low of 71.05, ahead of the European open on Friday. The pair tests 100-day EMA amid bullish MACD, which in turn signal brighter chances of the pair’s recovery.

In doing so, 50% Fibonacci retracement level of September-December fall, at 71.48 will be the immediate choice of buyers during the recovery. However, the pair’s further gains will be restricted by 61.8% Fibonacci retracement around 71.75.

In a case where USD/INR manages to stay positive beyond 71.75, the Bulls can take the reins to cross 72.00 while targeting September 2019 high of 72.63.

Alternatively, pair’s daily closing below 100-day EMA level of 71.10 can push prices further down to 23.6% Fibonacci retracement and 200-day EMA, near 70.86 and 70.72 respectively.

If the bears keep dominating past-70.72, December month bottom near 70.32 and 70.00 round-figure will return to the chart.

USD/INR daily chart
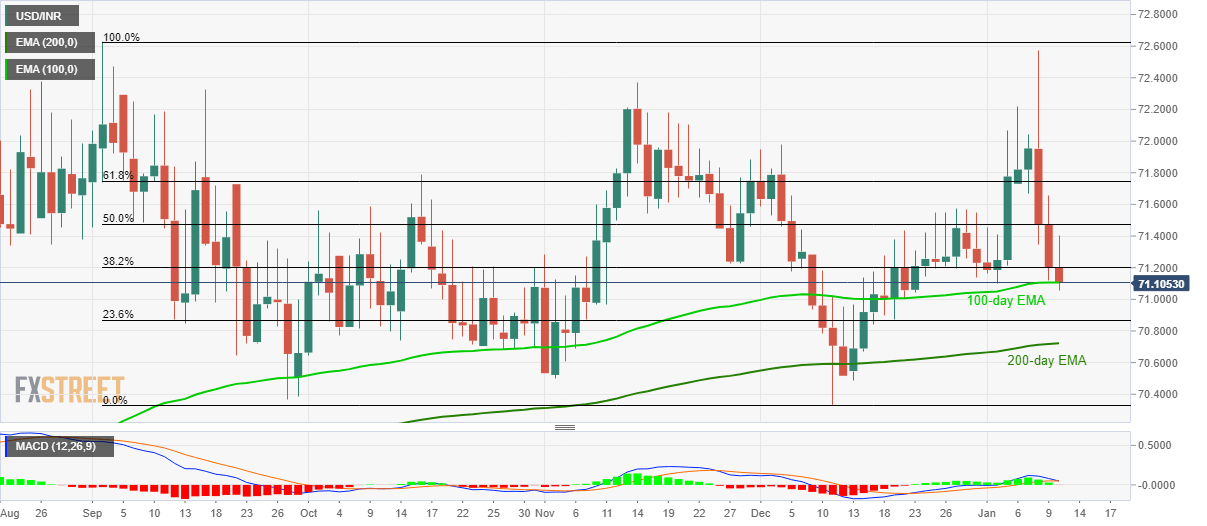
Trend: Pullback expected


GBP/USD consolidates losses amid pre-NFP lull

GBP/USD recovers the latest losses while taking the bids to 1.3080 ahead of the London open on Friday. The pair dropped the previous day after the BOE
อ่านเพิ่มเติม Previous

US Dollar Index looks flat around 97.40, Payrolls in sight

The greenback is trading within a sideline theme in the 97.40 region so far at the end of the week when gauged by the US Dollar Index (DXY). US Dollar
อ่านเพิ่มเติม Next