Confirming you are not from the U.S. or the Philippines

โดยการให้คำชี้แจงนี้ ข้าพเจ้าขอประกาศและยืนยันอย่างชัดเจนว่า:
  • ข้าพเจ้ามิใช่พลเมืองหรือผู้ที่พำนักอาศัยสหรัฐอเมริกา
  • ฉันไม่ใช่ผู้พำนักอาศัยในฟิลิปปินส์
  • ข้าพเจ้าไม่ได้เป็นเจ้าของหุ้น/สิทธิ์ในการออกเสียง/ผลประโยชน์ของผู้พำนักในสหรัฐอเมริกาทั้งทางตรงและทางอ้อมเกินกว่า 10% และ/หรือไม่ได้ควบคุมพลเมืองหรือผู้พำนักในสหรัฐอเมริกาด้วยวิธีการอื่น
  • ข้าพเจ้าไม่ได้อยู่ภายใต้ความเป็นเจ้าของโดยตรงหรือโดยอ้อมมากกว่า 10% ของจำนวนหุ้น/สิทธิในการออกเสียง/ดอกเบี้ยและ/หรืออยู่ภายใต้การควบคุมของพลเมืองสหรัฐอเมริกาหรือผู้พำนักอาศัยโดยใช้วิธีการอื่น
  • ข้าพเจ้าไม่มีส่วนเกี่ยวข้องกับพลเมืองหรือผู้พำนักในสหรัฐอเมริกาตามมาตรา 1504(a) ของ FATCA
  • ข้าพเจ้าตระหนักดีถึงความรับผิดของข้าพเจ้าในการแสดงข้อความอันเป็นเท็จ
สำหรับวัตถุประสงค์ของคำชี้แจงนี้ ประเทศและดินแดนที่อยู่ภายใต้การปกครองของสหรัฐอเมริกาทั้งหมดจะเท่ากับอาณาเขตหลักของสหรัฐอเมริกา ข้าพเจ้าให้คำมั่นที่จะปกป้องและปกป้อง Octa Markets Incorporated กรรมการและเจ้าหน้าที่ของ Octa Markets Incorporated จากการเรียกร้องใด ๆ ที่เกิดขึ้นจากหรือเกี่ยวข้องกับการละเมิดคำชี้แจงของข้าพเจ้าในที่นี้
เราทุ่มเทให้กับความเป็นส่วนตัวและความปลอดภัยของข้อมูลส่วนบุคคลของคุณ เรารวบรวมอีเมลเพื่อมอบข้อเสนอพิเศษและข้อมูลสำคัญเกี่ยวกับผลิตภัณฑ์และบริการของเราเท่านั้น โดยการมอบที่อยู่อีเมลของคุณ คุณตกลงที่จะรับจดหมายดังกล่าวจากเรา หากคุณต้องการบอกเลิกการรับจดหมายหรือมีคำถามหรือข้อสงสัยใด ๆ กรุณาส่งไปที่ฝ่ายบริการลูกค้าของเรา
Octa trading broker
เปิดบัญชีการเทรด
Back

USD/CAD Price Analysis: Under pressure in Asia, forming head-and-shoulders

  • USD/CAD is forming a head-and-shoulders on the hourly chart, 
  • A breakdown would open the doors to levels near 1.3150.

The Canadian dollar has found some love in Asia. The USD/CAD pair is currently trading at 1.3204, representing marginal losses on the day, having hit a low of 1.3195 earlier today. 

The hourly chart shows the pair is forming a head-and-shoulders bearish reversal pattern with the neckline support at 1.3191. 

A break below that level would open the doors to 1.3153 (target as per the measured move method). That looks likely as Thursday’s spinning top candle is reporting buyer exhaustion – the rally from the Dec. 31 low of 1.3069 has likely run out of steam. 

However, if the neckline support at 1.3191 if holds, a bounce to Thursday’s high of 1.3227 may be seen. A close higher would expose the resistance at 1.3247 – the 78.6% Fibonacci retracement of the sell-off from 1.3328 to 1.3069. 

Hourly chart

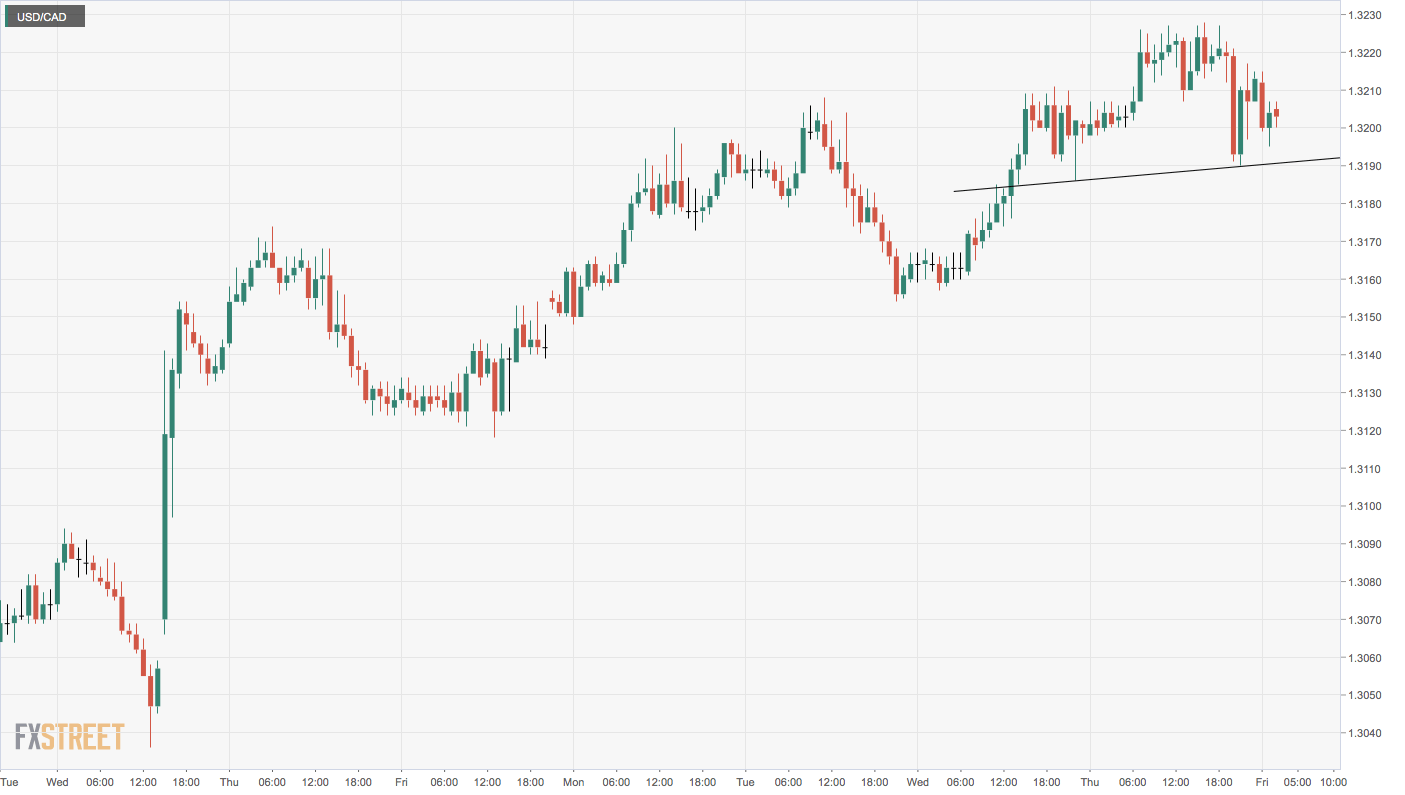
Trend: Bearish below 1.3191

Technical levels


RBA on hold; to cut 2020 growth forecast from 2.8% to 2.6% - Westpac

In the view of Bill Evans, analyst at Westpac, the Reserve Bank of Australia (RBA) will remain on hold next week and push back a rate cut to April, in
อ่านเพิ่มเติม Previous

US Pres. Trump: Coronavirus outbreak is 'very well under control'

In a speech at an auto parts manufacturer in Warren, Michigan, US President Donald Trump said that the US was cooperating with China on the coronaviru
อ่านเพิ่มเติม Next