Confirming you are not from the U.S. or the Philippines

โดยการให้คำชี้แจงนี้ ข้าพเจ้าขอประกาศและยืนยันอย่างชัดเจนว่า:
  • ข้าพเจ้ามิใช่พลเมืองหรือผู้ที่พำนักอาศัยสหรัฐอเมริกา
  • ฉันไม่ใช่ผู้พำนักอาศัยในฟิลิปปินส์
  • ข้าพเจ้าไม่ได้เป็นเจ้าของหุ้น/สิทธิ์ในการออกเสียง/ผลประโยชน์ของผู้พำนักในสหรัฐอเมริกาทั้งทางตรงและทางอ้อมเกินกว่า 10% และ/หรือไม่ได้ควบคุมพลเมืองหรือผู้พำนักในสหรัฐอเมริกาด้วยวิธีการอื่น
  • ข้าพเจ้าไม่ได้อยู่ภายใต้ความเป็นเจ้าของโดยตรงหรือโดยอ้อมมากกว่า 10% ของจำนวนหุ้น/สิทธิในการออกเสียง/ดอกเบี้ยและ/หรืออยู่ภายใต้การควบคุมของพลเมืองสหรัฐอเมริกาหรือผู้พำนักอาศัยโดยใช้วิธีการอื่น
  • ข้าพเจ้าไม่มีส่วนเกี่ยวข้องกับพลเมืองหรือผู้พำนักในสหรัฐอเมริกาตามมาตรา 1504(a) ของ FATCA
  • ข้าพเจ้าตระหนักดีถึงความรับผิดของข้าพเจ้าในการแสดงข้อความอันเป็นเท็จ
สำหรับวัตถุประสงค์ของคำชี้แจงนี้ ประเทศและดินแดนที่อยู่ภายใต้การปกครองของสหรัฐอเมริกาทั้งหมดจะเท่ากับอาณาเขตหลักของสหรัฐอเมริกา ข้าพเจ้าให้คำมั่นที่จะปกป้องและปกป้อง Octa Markets Incorporated กรรมการและเจ้าหน้าที่ของ Octa Markets Incorporated จากการเรียกร้องใด ๆ ที่เกิดขึ้นจากหรือเกี่ยวข้องกับการละเมิดคำชี้แจงของข้าพเจ้าในที่นี้
เราทุ่มเทให้กับความเป็นส่วนตัวและความปลอดภัยของข้อมูลส่วนบุคคลของคุณ เรารวบรวมอีเมลเพื่อมอบข้อเสนอพิเศษและข้อมูลสำคัญเกี่ยวกับผลิตภัณฑ์และบริการของเราเท่านั้น โดยการมอบที่อยู่อีเมลของคุณ คุณตกลงที่จะรับจดหมายดังกล่าวจากเรา หากคุณต้องการบอกเลิกการรับจดหมายหรือมีคำถามหรือข้อสงสัยใด ๆ กรุณาส่งไปที่ฝ่ายบริการลูกค้าของเรา
Octa trading broker
เปิดบัญชีการเทรด
Back

USD/CAD Price Analysis: Positive above resistance-turned-support trendline

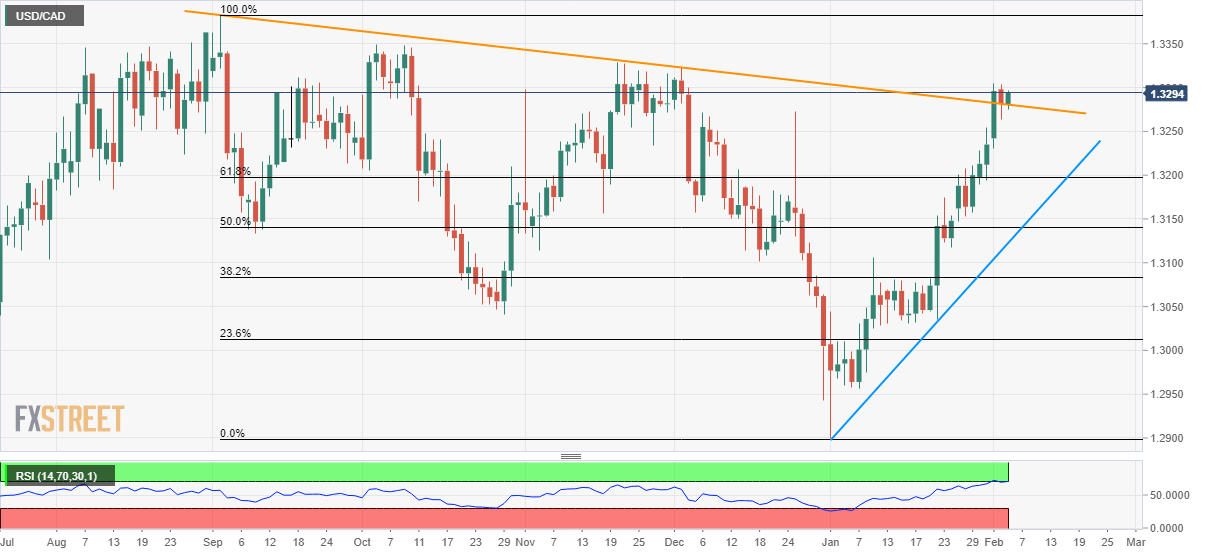
  • USD/CAD bounces off a five-month-old falling support line (previous resistance).
  • November, October 2019 highs are on the bull’s radar.
  • 61.8% of Fibonacci retracement could return to the charts on the downside break.

USD/CAD takes the bids to 1.3295 during the early Wednesday. The pair recently took a U-turn from a multi-month-old support line that it crossed two days back.

The pair now aims for November month high of 1.3330 while its further upside could challenge October month top surrounding 1.3350.

If overbought RSI conditions fail to disappoint buyers around 1.3350, September highs near 1.3385 and 1.3400 could please return to the charts.

Meanwhile, the downside break of the resistance-turned-support trend line, at 1.3280 now, can trigger the pair’s fresh declines to 1.3220 and 61.8% Fibonacci retracement of September-December 2019 declines, near 1.3200.

During the course of the pair’s south-run past-1.3200, 50% Fibonacci retracement level of 1.3140 and a five-week-old rising support line, around 1.3120, could please the bears.

USD/CAD daily chart
Trend: Bullish


Govt Source: India's Jan gold imports plunge 48% to four-month low on record prices – Reuters

An Indian government source said late Tuesday that the country’s gold imports plunged 48% in January over the year, per Reuters. The imports for the y
อ่านเพิ่มเติม Previous

Gold: Pullback stalls near key Fib support

Gold is currently trading at $1,556 per Oz, representing a 0.22% gain on the day. The yellow metal turned lower from $1,594 on Monday and almost teste
อ่านเพิ่มเติม Next