Confirming you are not from the U.S. or the Philippines

โดยการให้คำชี้แจงนี้ ข้าพเจ้าขอประกาศและยืนยันอย่างชัดเจนว่า:
  • ข้าพเจ้ามิใช่พลเมืองหรือผู้ที่พำนักอาศัยสหรัฐอเมริกา
  • ฉันไม่ใช่ผู้พำนักอาศัยในฟิลิปปินส์
  • ข้าพเจ้าไม่ได้เป็นเจ้าของหุ้น/สิทธิ์ในการออกเสียง/ผลประโยชน์ของผู้พำนักในสหรัฐอเมริกาทั้งทางตรงและทางอ้อมเกินกว่า 10% และ/หรือไม่ได้ควบคุมพลเมืองหรือผู้พำนักในสหรัฐอเมริกาด้วยวิธีการอื่น
  • ข้าพเจ้าไม่ได้อยู่ภายใต้ความเป็นเจ้าของโดยตรงหรือโดยอ้อมมากกว่า 10% ของจำนวนหุ้น/สิทธิในการออกเสียง/ดอกเบี้ยและ/หรืออยู่ภายใต้การควบคุมของพลเมืองสหรัฐอเมริกาหรือผู้พำนักอาศัยโดยใช้วิธีการอื่น
  • ข้าพเจ้าไม่มีส่วนเกี่ยวข้องกับพลเมืองหรือผู้พำนักในสหรัฐอเมริกาตามมาตรา 1504(a) ของ FATCA
  • ข้าพเจ้าตระหนักดีถึงความรับผิดของข้าพเจ้าในการแสดงข้อความอันเป็นเท็จ
สำหรับวัตถุประสงค์ของคำชี้แจงนี้ ประเทศและดินแดนที่อยู่ภายใต้การปกครองของสหรัฐอเมริกาทั้งหมดจะเท่ากับอาณาเขตหลักของสหรัฐอเมริกา ข้าพเจ้าให้คำมั่นที่จะปกป้องและปกป้อง Octa Markets Incorporated กรรมการและเจ้าหน้าที่ของ Octa Markets Incorporated จากการเรียกร้องใด ๆ ที่เกิดขึ้นจากหรือเกี่ยวข้องกับการละเมิดคำชี้แจงของข้าพเจ้าในที่นี้
Back

NZD/USD Price Analysis: Bounces off 11-week low after China data

  • NZD/USD remains below 61.8% Fibonacci retracement despite China CPI-led pullback.
  • November 2019 low can please sellers while buyers will avoid entry below 200-day SMA.

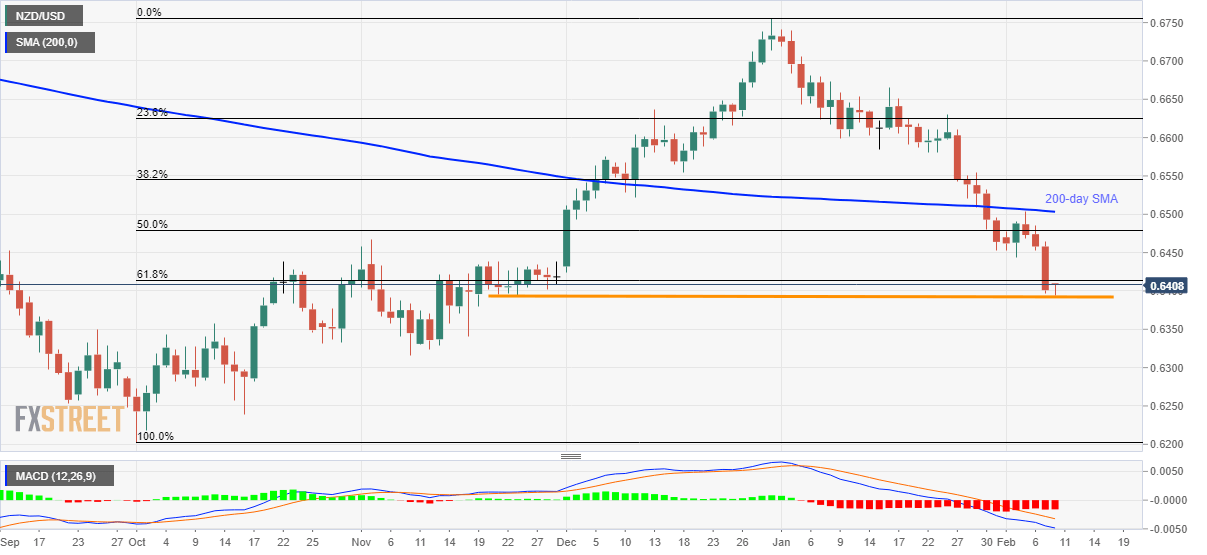
NZD/USD pulls back from multi-week low to 0.6405 after China released January month inflation data on early Monday.

Read: Chinese CPI YoY (Jan): 5.4% vs 4.9% expected and 4.5% prior, (fastest rise since Oct 2011)

While better than forecast CPI and PPI readings triggered the quote’s bounce from the lowest since November 21, 2019, the quote still remains below the key resistances and remains on the bears’ radar.

Among them, 61.8% Fibonacci retracement of October-December 2019 upside, at 0.6415, acts as the immediate upside barrier, a break of which could challenge January lows near 0.6455/50.

Even if the pair manage to cross 0.6455 on a daily closing basis, 50% Fibonacci retracement and 200-day SMA, around 0.6480 and 0.6505 respectively, will keep buyers in check.

Alternatively, the pair’s declines below 0.6400/0.6395 horizontal support can drag it towards November month bottom surrounding 0.6315.

Assuming the bear’s dominance past-0.6315, 0.6240 will offer an intermediate halt to the southward trajectory targeting the year 2019 low near 0.6200.

NZD/USD daily chart
Trend: Bearish


ECB's Visco: Italy's GDP growth will remain very low this year - Bloomberg

Italy's gross domestic product (GDP) growth rate will remain very low this year as global headwinds such as the coronavirus outbreak are seen adding t
อ่านเพิ่มเติม Previous

Australia, Indonesia seal free trade deal – Associated Press

In a joint press conference on Monday, the Australian PM Morrison and Indonesian President Joko Widodo announced that an historic trade deal between b
อ่านเพิ่มเติม Next