Confirming you are not from the U.S. or the Philippines

โดยการให้คำชี้แจงนี้ ข้าพเจ้าขอประกาศและยืนยันอย่างชัดเจนว่า:
  • ข้าพเจ้ามิใช่พลเมืองหรือผู้ที่พำนักอาศัยสหรัฐอเมริกา
  • ฉันไม่ใช่ผู้พำนักอาศัยในฟิลิปปินส์
  • ข้าพเจ้าไม่ได้เป็นเจ้าของหุ้น/สิทธิ์ในการออกเสียง/ผลประโยชน์ของผู้พำนักในสหรัฐอเมริกาทั้งทางตรงและทางอ้อมเกินกว่า 10% และ/หรือไม่ได้ควบคุมพลเมืองหรือผู้พำนักในสหรัฐอเมริกาด้วยวิธีการอื่น
  • ข้าพเจ้าไม่ได้อยู่ภายใต้ความเป็นเจ้าของโดยตรงหรือโดยอ้อมมากกว่า 10% ของจำนวนหุ้น/สิทธิในการออกเสียง/ดอกเบี้ยและ/หรืออยู่ภายใต้การควบคุมของพลเมืองสหรัฐอเมริกาหรือผู้พำนักอาศัยโดยใช้วิธีการอื่น
  • ข้าพเจ้าไม่มีส่วนเกี่ยวข้องกับพลเมืองหรือผู้พำนักในสหรัฐอเมริกาตามมาตรา 1504(a) ของ FATCA
  • ข้าพเจ้าตระหนักดีถึงความรับผิดของข้าพเจ้าในการแสดงข้อความอันเป็นเท็จ
สำหรับวัตถุประสงค์ของคำชี้แจงนี้ ประเทศและดินแดนที่อยู่ภายใต้การปกครองของสหรัฐอเมริกาทั้งหมดจะเท่ากับอาณาเขตหลักของสหรัฐอเมริกา ข้าพเจ้าให้คำมั่นที่จะปกป้องและปกป้อง Octa Markets Incorporated กรรมการและเจ้าหน้าที่ของ Octa Markets Incorporated จากการเรียกร้องใด ๆ ที่เกิดขึ้นจากหรือเกี่ยวข้องกับการละเมิดคำชี้แจงของข้าพเจ้าในที่นี้
เราทุ่มเทให้กับความเป็นส่วนตัวและความปลอดภัยของข้อมูลส่วนบุคคลของคุณ เรารวบรวมอีเมลเพื่อมอบข้อเสนอพิเศษและข้อมูลสำคัญเกี่ยวกับผลิตภัณฑ์และบริการของเราเท่านั้น โดยการมอบที่อยู่อีเมลของคุณ คุณตกลงที่จะรับจดหมายดังกล่าวจากเรา หากคุณต้องการบอกเลิกการรับจดหมายหรือมีคำถามหรือข้อสงสัยใด ๆ กรุณาส่งไปที่ฝ่ายบริการลูกค้าของเรา
Octa trading broker
เปิดบัญชีการเทรด
Back

USD/CAD Price Analysis: Wedge breakout fails to inspire bulls

  • USD/CAD is on the offer despite the falling wedge breakout on the 4H chart. 
  • Tuesday's high of 1.3278 needs to breached to confirm a bullish revival.

USD/CAD is struggling to gather upside traction despite a bullish continuation setup on the 4-hour chart. 

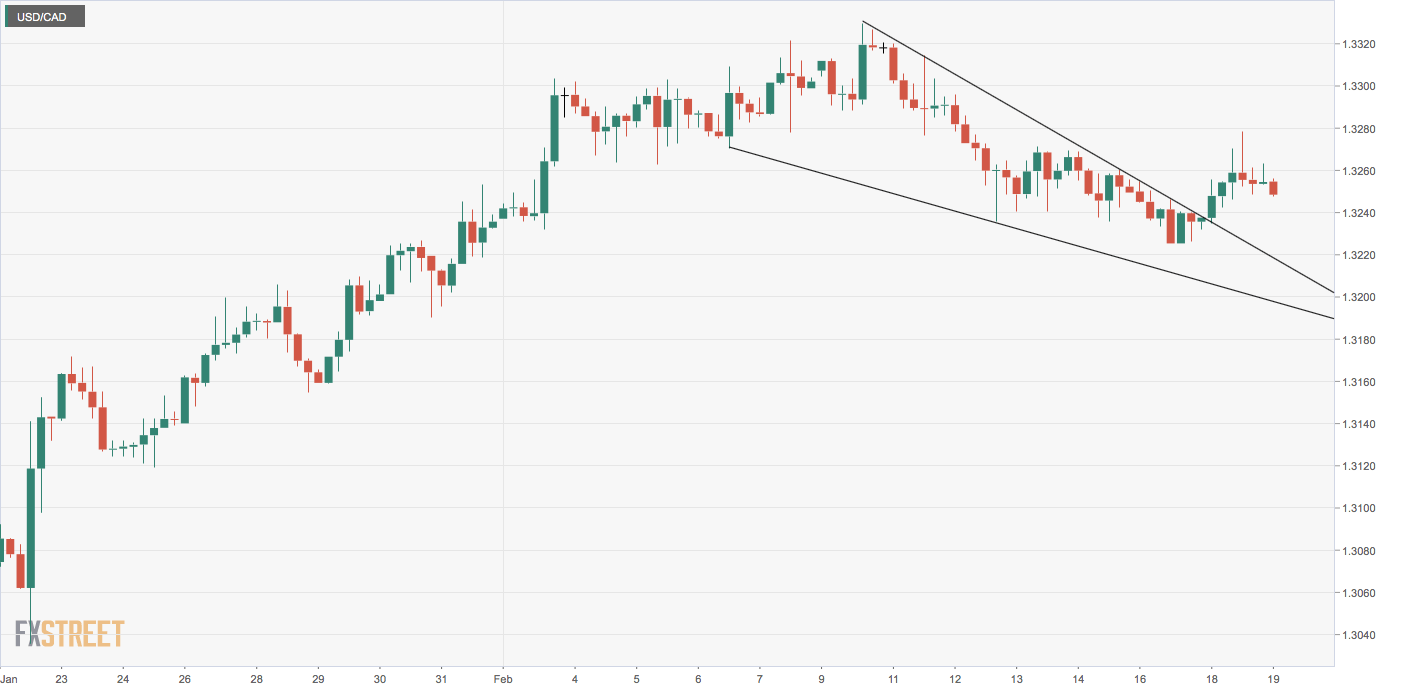
The pair broke out of a falling wedge pattern on Monday, signaling a continuation of the recent rally from the December low of 1.2951. 

The post-breakout upside, however, stalled at 1.3278 on Tuesday, allowing sellers to push the spot back to levels near 1.3250 where it is currently trading. 

Tuesday’s high of 1.3278 is now the level to beat for the bulls. A break higher would expose the recent high of 1.3329. 

Alternatively, if sellers manage to establish a secure foothold below 1.3225 (Feb. 17 low), additional losses toward 1.3185 could be seen. That level marks the 38.2% Fibonacci retracement of the rally from 1.2951 to 1.3329. 

4-hour chart

Trend: Bearish below 1.3225

Technical levels


Gold: Buy the dips amid lingering macro uncertainty – UBS

The UBS analysts stay bullish on gold’s outlook and recommend ‘buy the dips’ strategy amid looming macro uncertainty. Key Quotes: “Investors look to b
อ่านเพิ่มเติม Previous

S. Korea confirms 15 new coronavirus cases, Hong Kong reports 2nd death

Amid a slowdown in the number of new cases reported in China’s Hubei province, the epicenter of the coronavirus outbreak, unfortunately, across the bo
อ่านเพิ่มเติม Next