Confirming you are not from the U.S. or the Philippines

โดยการให้คำชี้แจงนี้ ข้าพเจ้าขอประกาศและยืนยันอย่างชัดเจนว่า:
  • ข้าพเจ้ามิใช่พลเมืองหรือผู้ที่พำนักอาศัยสหรัฐอเมริกา
  • ฉันไม่ใช่ผู้พำนักอาศัยในฟิลิปปินส์
  • ข้าพเจ้าไม่ได้เป็นเจ้าของหุ้น/สิทธิ์ในการออกเสียง/ผลประโยชน์ของผู้พำนักในสหรัฐอเมริกาทั้งทางตรงและทางอ้อมเกินกว่า 10% และ/หรือไม่ได้ควบคุมพลเมืองหรือผู้พำนักในสหรัฐอเมริกาด้วยวิธีการอื่น
  • ข้าพเจ้าไม่ได้อยู่ภายใต้ความเป็นเจ้าของโดยตรงหรือโดยอ้อมมากกว่า 10% ของจำนวนหุ้น/สิทธิในการออกเสียง/ดอกเบี้ยและ/หรืออยู่ภายใต้การควบคุมของพลเมืองสหรัฐอเมริกาหรือผู้พำนักอาศัยโดยใช้วิธีการอื่น
  • ข้าพเจ้าไม่มีส่วนเกี่ยวข้องกับพลเมืองหรือผู้พำนักในสหรัฐอเมริกาตามมาตรา 1504(a) ของ FATCA
  • ข้าพเจ้าตระหนักดีถึงความรับผิดของข้าพเจ้าในการแสดงข้อความอันเป็นเท็จ
สำหรับวัตถุประสงค์ของคำชี้แจงนี้ ประเทศและดินแดนที่อยู่ภายใต้การปกครองของสหรัฐอเมริกาทั้งหมดจะเท่ากับอาณาเขตหลักของสหรัฐอเมริกา ข้าพเจ้าให้คำมั่นที่จะปกป้องและปกป้อง Octa Markets Incorporated กรรมการและเจ้าหน้าที่ของ Octa Markets Incorporated จากการเรียกร้องใด ๆ ที่เกิดขึ้นจากหรือเกี่ยวข้องกับการละเมิดคำชี้แจงของข้าพเจ้าในที่นี้
เราทุ่มเทให้กับความเป็นส่วนตัวและความปลอดภัยของข้อมูลส่วนบุคคลของคุณ เรารวบรวมอีเมลเพื่อมอบข้อเสนอพิเศษและข้อมูลสำคัญเกี่ยวกับผลิตภัณฑ์และบริการของเราเท่านั้น โดยการมอบที่อยู่อีเมลของคุณ คุณตกลงที่จะรับจดหมายดังกล่าวจากเรา หากคุณต้องการบอกเลิกการรับจดหมายหรือมีคำถามหรือข้อสงสัยใด ๆ กรุณาส่งไปที่ฝ่ายบริการลูกค้าของเรา
Octa trading broker
เปิดบัญชีการเทรด
Back

USD/CHF Price Analysis: Bulls aim for 200-week SMA as MACD turns strongest in nine weeks

  • USD/CHF registers three-week winning streak, breaks above 38.2% Fibonacci retracement for the first time in a year.
  • 61.8% Fibonacci retracement, September 2018 low act as the key supports.

USD/CHF takes the bids to 0.9835 amid the pre-European session on Wednesday. In doing so, the pair crosses 38.2% Fibonacci retracement of its broad run-up between February 2018 and April 2019. Also supporting the pair’s upside is a first in nine weeks bullish MACD signal.

Based on that, buyers are again targeting a 200-week SMA level of 0.9850 whereas a descending trend line from April 2019, at 0.9940 can question the bulls afterward.

In a case where the USD/CHF prices stay strong beyond 0.9940, chances of witnessing the 1.0000 mark on the chart can’t be ruled out.

Alternatively, 0.9770/65 and 50% Fibonacci retracement level around 0.9710 can entertain sellers during the pullback ahead of pleasing them with the yearly bottom of 0.9612.

However, 61.8% Fibonacci retracement and September 2018 trough near 0.9585 and 0.9540 respectively could challenge the bears during the further declines.

USD/CHF weekly chart
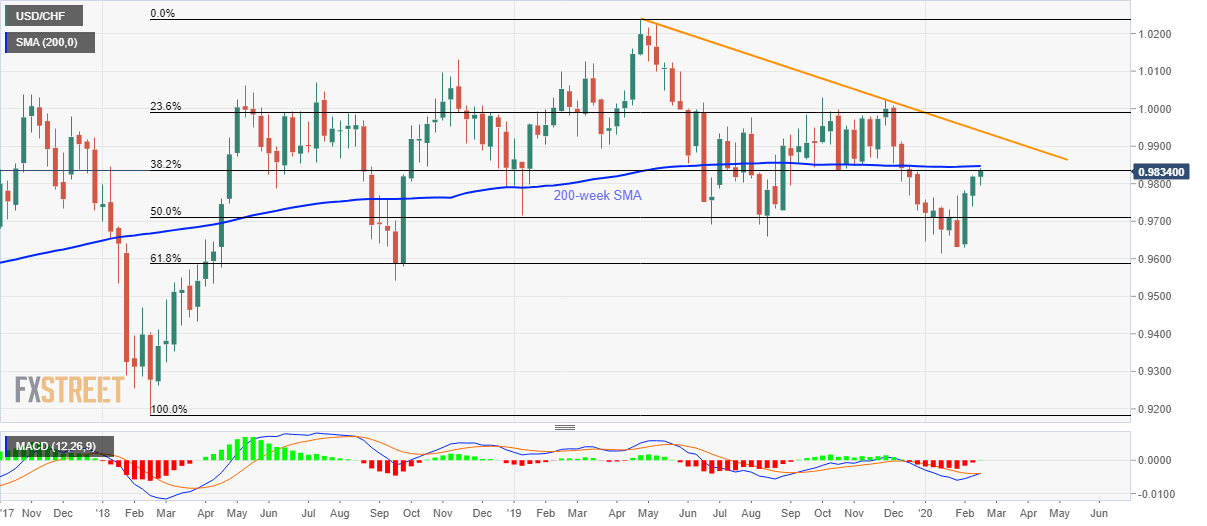
Trend: Bullish


China dumps US Treasuries for the sixth straight month in December

According to the US Treasury Department report released Tuesday, China’s total shrank $54.4 billion on the year to $1.07 trillion. China sold around $
อ่านเพิ่มเติม Previous

USD/JPY Price Analysis: Rises above 110, but bull breakout still elusive

The bid tone around the anti-risk Japanese yen weakened, allowing USD/JPY to rise to 110.11, as the futures on the S&P 500 ticked higher hinting at ri
อ่านเพิ่มเติม Next