

GBP/USD Price Analysis: 15-week-old rising trendline on bears’ radar
- GBP/USD remains weak around the seven-day low.
- Prices continue the pullback from 50-day SMA amid bearish MACD.
- An ascending trend line from early-November 2019, 50% Fibonacci retracement can question the sellers.
GBP/USD declines to 1.2920 during Thursday’s Asian session. In doing so, the pair extends its U-turn from 50-day SMA while nearing the key support trend line from November 2019. Also supporting the odds of the pair’s further declines could be the bearish MACD.
As a result, sellers target the multi-week-old support line, at 1.2885 as the immediate support ahead of aiming the 50% Fibonacci retracement of the pair’s October-December 2019 upside, at 1.2855.
However, the pair’s further downside below 1.2855 can only have November 2019 low of 1.2770 to please the sellers ahead of challenging them with 1.2700/2695 confluence that includes 61.8% Fibonacci retracement and 200-day SMA.
On the contrary, a clear upside beyond 50-day SMA level of 1.3060 enables the buyers to aim for the monthly high hear 1.3070 ahead of confronting 1.3200 resistance, comprising the 23.6% Fibonacci retracement.
GBP/USD daily chart
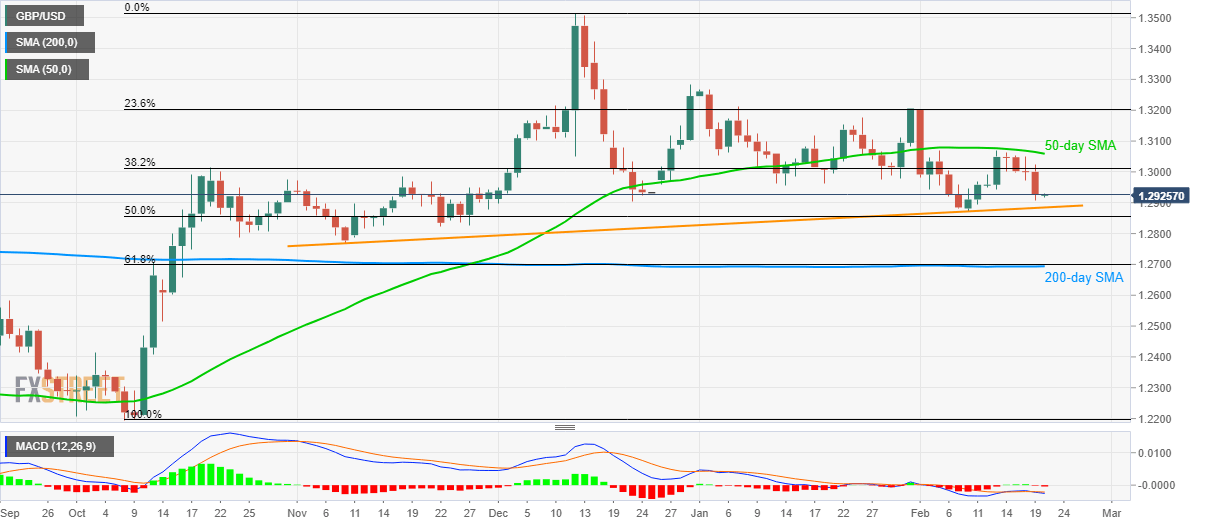
Trend: Bearish