Confirming you are not from the U.S. or the Philippines

โดยการให้คำชี้แจงนี้ ข้าพเจ้าขอประกาศและยืนยันอย่างชัดเจนว่า:
  • ข้าพเจ้ามิใช่พลเมืองหรือผู้ที่พำนักอาศัยสหรัฐอเมริกา
  • ฉันไม่ใช่ผู้พำนักอาศัยในฟิลิปปินส์
  • ข้าพเจ้าไม่ได้เป็นเจ้าของหุ้น/สิทธิ์ในการออกเสียง/ผลประโยชน์ของผู้พำนักในสหรัฐอเมริกาทั้งทางตรงและทางอ้อมเกินกว่า 10% และ/หรือไม่ได้ควบคุมพลเมืองหรือผู้พำนักในสหรัฐอเมริกาด้วยวิธีการอื่น
  • ข้าพเจ้าไม่ได้อยู่ภายใต้ความเป็นเจ้าของโดยตรงหรือโดยอ้อมมากกว่า 10% ของจำนวนหุ้น/สิทธิในการออกเสียง/ดอกเบี้ยและ/หรืออยู่ภายใต้การควบคุมของพลเมืองสหรัฐอเมริกาหรือผู้พำนักอาศัยโดยใช้วิธีการอื่น
  • ข้าพเจ้าไม่มีส่วนเกี่ยวข้องกับพลเมืองหรือผู้พำนักในสหรัฐอเมริกาตามมาตรา 1504(a) ของ FATCA
  • ข้าพเจ้าตระหนักดีถึงความรับผิดของข้าพเจ้าในการแสดงข้อความอันเป็นเท็จ
สำหรับวัตถุประสงค์ของคำชี้แจงนี้ ประเทศและดินแดนที่อยู่ภายใต้การปกครองของสหรัฐอเมริกาทั้งหมดจะเท่ากับอาณาเขตหลักของสหรัฐอเมริกา ข้าพเจ้าให้คำมั่นที่จะปกป้องและปกป้อง Octa Markets Incorporated กรรมการและเจ้าหน้าที่ของ Octa Markets Incorporated จากการเรียกร้องใด ๆ ที่เกิดขึ้นจากหรือเกี่ยวข้องกับการละเมิดคำชี้แจงของข้าพเจ้าในที่นี้
เราทุ่มเทให้กับความเป็นส่วนตัวและความปลอดภัยของข้อมูลส่วนบุคคลของคุณ เรารวบรวมอีเมลเพื่อมอบข้อเสนอพิเศษและข้อมูลสำคัญเกี่ยวกับผลิตภัณฑ์และบริการของเราเท่านั้น โดยการมอบที่อยู่อีเมลของคุณ คุณตกลงที่จะรับจดหมายดังกล่าวจากเรา หากคุณต้องการบอกเลิกการรับจดหมายหรือมีคำถามหรือข้อสงสัยใด ๆ กรุณาส่งไปที่ฝ่ายบริการลูกค้าของเรา
Octa trading broker
เปิดบัญชีการเทรด
Back

USD/JPY Price Analysis: Eyes on long-term resistance-turned-support trendline

  • USD/JPY struggles to rise beyond a 10-month high.
  • The quote pierces a downward sloping trend line from January 2017, sustained break on a weekly basis can confirm further upside.
  • 200-week SMA acts as key support.

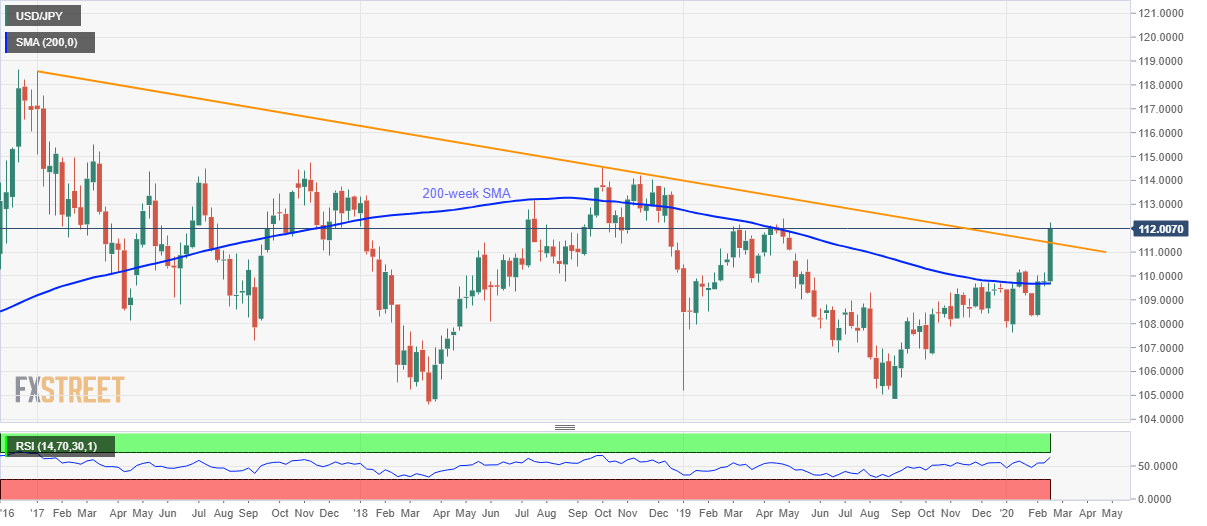
USD/JPY steps back to 112.00, down 0.07%, during the pre-European session on Friday. Even so, the pair stays above the multi-month-old falling trend line on a weekly basis.

Should the pair closes the week beyond 111.40 resistance-turned-support, its run-up to 112.40 and November 2018 high near 114.20 can be expected.

During the pair’s extended rise past-114.20, October 2018 top surrounding 114.55 will be on the bulls’ radar.

Meanwhile, a downside break of 111.40 on the weekly closing basis can recall a 200-week SMA level of 109.70.

However, 111.00 and January 2020 peak close to 110.30 may offer intermediate halts to the declines.

USD/JPY weekly chart

Trend: Bullish


Gold hits fresh seven-year high

Gold is flashing green for the fourth straight day and is currently trading at $1,624, the highest level February 2013. The anti-risk yellow metal con
อ่านเพิ่มเติม Previous

Dollar Index Price Analysis: Golden cross suggests greenback is closing on interim top

The dollar index, which tracks the value of the greenback against majors, could be nearing an interim top, as a big-time lagging indicator has turned
อ่านเพิ่มเติม Next