Confirming you are not from the U.S. or the Philippines

โดยการให้คำชี้แจงนี้ ข้าพเจ้าขอประกาศและยืนยันอย่างชัดเจนว่า:
  • ข้าพเจ้ามิใช่พลเมืองหรือผู้ที่พำนักอาศัยสหรัฐอเมริกา
  • ฉันไม่ใช่ผู้พำนักอาศัยในฟิลิปปินส์
  • ข้าพเจ้าไม่ได้เป็นเจ้าของหุ้น/สิทธิ์ในการออกเสียง/ผลประโยชน์ของผู้พำนักในสหรัฐอเมริกาทั้งทางตรงและทางอ้อมเกินกว่า 10% และ/หรือไม่ได้ควบคุมพลเมืองหรือผู้พำนักในสหรัฐอเมริกาด้วยวิธีการอื่น
  • ข้าพเจ้าไม่ได้อยู่ภายใต้ความเป็นเจ้าของโดยตรงหรือโดยอ้อมมากกว่า 10% ของจำนวนหุ้น/สิทธิในการออกเสียง/ดอกเบี้ยและ/หรืออยู่ภายใต้การควบคุมของพลเมืองสหรัฐอเมริกาหรือผู้พำนักอาศัยโดยใช้วิธีการอื่น
  • ข้าพเจ้าไม่มีส่วนเกี่ยวข้องกับพลเมืองหรือผู้พำนักในสหรัฐอเมริกาตามมาตรา 1504(a) ของ FATCA
  • ข้าพเจ้าตระหนักดีถึงความรับผิดของข้าพเจ้าในการแสดงข้อความอันเป็นเท็จ
สำหรับวัตถุประสงค์ของคำชี้แจงนี้ ประเทศและดินแดนที่อยู่ภายใต้การปกครองของสหรัฐอเมริกาทั้งหมดจะเท่ากับอาณาเขตหลักของสหรัฐอเมริกา ข้าพเจ้าให้คำมั่นที่จะปกป้องและปกป้อง Octa Markets Incorporated กรรมการและเจ้าหน้าที่ของ Octa Markets Incorporated จากการเรียกร้องใด ๆ ที่เกิดขึ้นจากหรือเกี่ยวข้องกับการละเมิดคำชี้แจงของข้าพเจ้าในที่นี้
เราทุ่มเทให้กับความเป็นส่วนตัวและความปลอดภัยของข้อมูลส่วนบุคคลของคุณ เรารวบรวมอีเมลเพื่อมอบข้อเสนอพิเศษและข้อมูลสำคัญเกี่ยวกับผลิตภัณฑ์และบริการของเราเท่านั้น โดยการมอบที่อยู่อีเมลของคุณ คุณตกลงที่จะรับจดหมายดังกล่าวจากเรา หากคุณต้องการบอกเลิกการรับจดหมายหรือมีคำถามหรือข้อสงสัยใด ๆ กรุณาส่งไปที่ฝ่ายบริการลูกค้าของเรา
Octa trading broker
เปิดบัญชีการเทรด
Back

Gold Price Analysis: Drops back below $1,500, focus on key Fibonacci levels

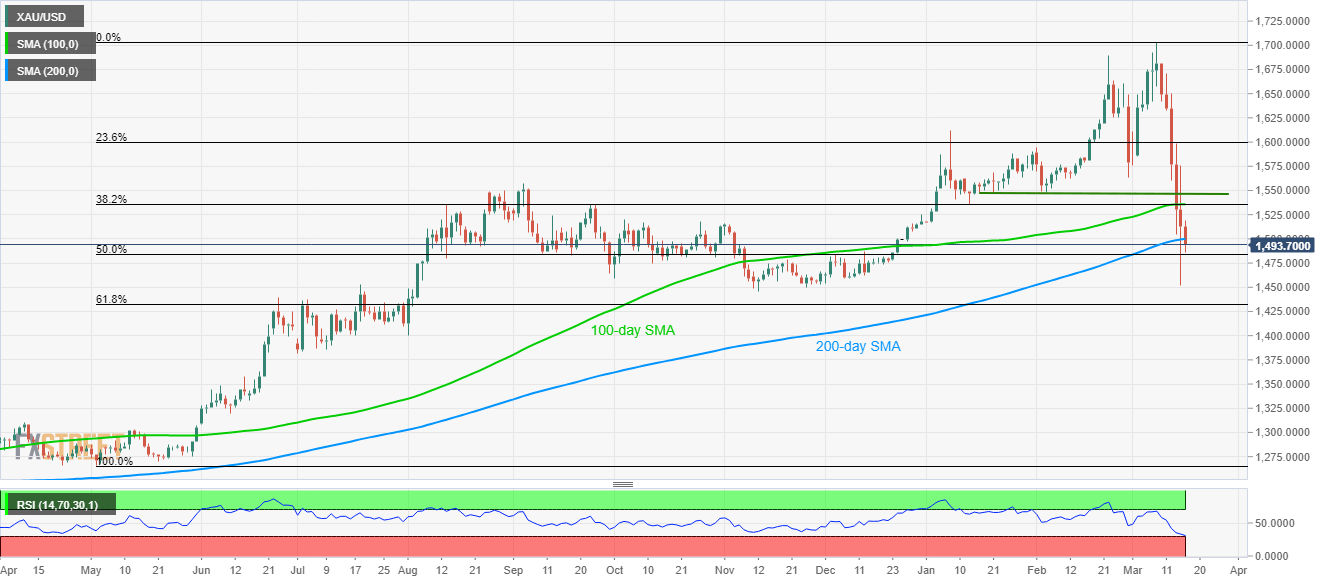
  • Gold prices fail to hold onto the early-day recovery gains, slips beneath 200-day SMA.
  • A confluence of 100-day SMA, 38.2% Fibonacci retracement limit near-term upside.
  • November 2019 low, 61.8% Fibonacci retracement on the bears’ radars.

Following the latest pullback from $1,520, Gold prices decline to $1,493, down 1.27%, as the global markets await European traders on Tuesday.

With that, the bullion slips back below 200-day SMA while inching closer to 50% Fibonacci retracement of its run-up from May 2019 to March 2020, at $1,483.

During the quote’s further downside below 50% Fibonacci retracement, November 2019 low surrounding $1,445 and 61.8% of Fibonacci retracement near $1,432 can please the bears.

On the flip side, a confluence of 100-day SMA and 38.2% Fibonacci retracement restricts the yellow metal’s short-term recovery moves near $1,535/36.

Beyond that, lows marked during late-January 2020, also during the February month, around $1,545/46, could question the bulls.

Gold daily chart
Trend: Further declines likely


AUD/USD risk reversals show record demand for put options

One-month risk reversals (AUD1MRR), a gauge of calls to puts on AUD/USD, fell on Tuesday to a record low, as investors rushed to protect themselves fr
อ่านเพิ่มเติม Next