Confirming you are not from the U.S. or the Philippines

โดยการให้คำชี้แจงนี้ ข้าพเจ้าขอประกาศและยืนยันอย่างชัดเจนว่า:
  • ข้าพเจ้ามิใช่พลเมืองหรือผู้ที่พำนักอาศัยสหรัฐอเมริกา
  • ฉันไม่ใช่ผู้พำนักอาศัยในฟิลิปปินส์
  • ข้าพเจ้าไม่ได้เป็นเจ้าของหุ้น/สิทธิ์ในการออกเสียง/ผลประโยชน์ของผู้พำนักในสหรัฐอเมริกาทั้งทางตรงและทางอ้อมเกินกว่า 10% และ/หรือไม่ได้ควบคุมพลเมืองหรือผู้พำนักในสหรัฐอเมริกาด้วยวิธีการอื่น
  • ข้าพเจ้าไม่ได้อยู่ภายใต้ความเป็นเจ้าของโดยตรงหรือโดยอ้อมมากกว่า 10% ของจำนวนหุ้น/สิทธิในการออกเสียง/ดอกเบี้ยและ/หรืออยู่ภายใต้การควบคุมของพลเมืองสหรัฐอเมริกาหรือผู้พำนักอาศัยโดยใช้วิธีการอื่น
  • ข้าพเจ้าไม่มีส่วนเกี่ยวข้องกับพลเมืองหรือผู้พำนักในสหรัฐอเมริกาตามมาตรา 1504(a) ของ FATCA
  • ข้าพเจ้าตระหนักดีถึงความรับผิดของข้าพเจ้าในการแสดงข้อความอันเป็นเท็จ
สำหรับวัตถุประสงค์ของคำชี้แจงนี้ ประเทศและดินแดนที่อยู่ภายใต้การปกครองของสหรัฐอเมริกาทั้งหมดจะเท่ากับอาณาเขตหลักของสหรัฐอเมริกา ข้าพเจ้าให้คำมั่นที่จะปกป้องและปกป้อง Octa Markets Incorporated กรรมการและเจ้าหน้าที่ของ Octa Markets Incorporated จากการเรียกร้องใด ๆ ที่เกิดขึ้นจากหรือเกี่ยวข้องกับการละเมิดคำชี้แจงของข้าพเจ้าในที่นี้
เราทุ่มเทให้กับความเป็นส่วนตัวและความปลอดภัยของข้อมูลส่วนบุคคลของคุณ เรารวบรวมอีเมลเพื่อมอบข้อเสนอพิเศษและข้อมูลสำคัญเกี่ยวกับผลิตภัณฑ์และบริการของเราเท่านั้น โดยการมอบที่อยู่อีเมลของคุณ คุณตกลงที่จะรับจดหมายดังกล่าวจากเรา หากคุณต้องการบอกเลิกการรับจดหมายหรือมีคำถามหรือข้อสงสัยใด ๆ กรุณาส่งไปที่ฝ่ายบริการลูกค้าของเรา
Octa trading broker
เปิดบัญชีการเทรด
Back

WTI Price Analysis: Bears keep the helm below 61.8% Fibonacci

  • WTI remains on the back foot while following the immediate descending trend line since Friday.
  • The monthly low, $20.00 are on the bears’ radars.
  • 200-HMA, an eight-day-old falling resistance line add to the upside barriers.

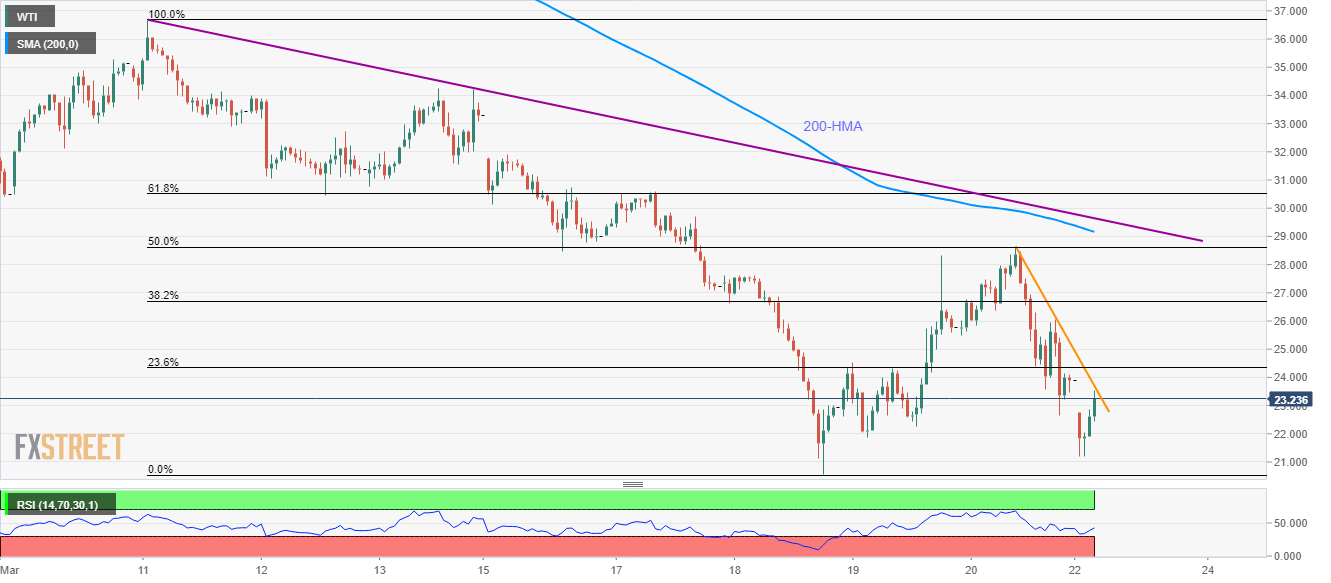
Despite bouncing off $21.20 to $23.30, down 2.35%, WTI remains under pressure amid Monday’s Asian session. The oil benchmark currently probes short-term falling trend line while 50% Fibonacci retracement of its March 11-18 declines and 200-HMA, adjacent to a bit broader resistance, limit the near-term upside.

Should the buyers manage to cross the immediate resistance line, currently at $23.70, the black gold can accelerate the recovery moves to 50% Fibonacci retracement level near $28.60.

However, 200-HMA and the aforementioned falling trend line could challenge the buyers around $29.20 and $29.65 respectively.

It should also be noted that the oil price run-up beyond $29.65 needs to overcome a 61.8% Fibonacci retracement level of $30.50 to convince buyers.

Meanwhile, the quote’s downside below $21.20 can aim the monthly low near $20.50 and $20.00 round-figures.

WTI hourly chart

Trend: Bearish


US initial jobless claims to rise to 3 million this week - Bank of America Merrill Lynch

Bank of America Merrill Lynch expects the US initial jobless claims or the number of new jobless claims for unemployment benefits filed by unemployed
อ่านเพิ่มเติม Previous

EUR/USD Price Analysis: Bounces off multi-month low to regain 1.0720

Following its initial drop to a 35-month low, EUR/USD marks 0.13% gains to 1.0711, with an intraday high of 1.0720, amid the early Monday. While takin
อ่านเพิ่มเติม Next