Confirming you are not from the U.S. or the Philippines

โดยการให้คำชี้แจงนี้ ข้าพเจ้าขอประกาศและยืนยันอย่างชัดเจนว่า:
  • ข้าพเจ้ามิใช่พลเมืองหรือผู้ที่พำนักอาศัยสหรัฐอเมริกา
  • ฉันไม่ใช่ผู้พำนักอาศัยในฟิลิปปินส์
  • ข้าพเจ้าไม่ได้เป็นเจ้าของหุ้น/สิทธิ์ในการออกเสียง/ผลประโยชน์ของผู้พำนักในสหรัฐอเมริกาทั้งทางตรงและทางอ้อมเกินกว่า 10% และ/หรือไม่ได้ควบคุมพลเมืองหรือผู้พำนักในสหรัฐอเมริกาด้วยวิธีการอื่น
  • ข้าพเจ้าไม่ได้อยู่ภายใต้ความเป็นเจ้าของโดยตรงหรือโดยอ้อมมากกว่า 10% ของจำนวนหุ้น/สิทธิในการออกเสียง/ดอกเบี้ยและ/หรืออยู่ภายใต้การควบคุมของพลเมืองสหรัฐอเมริกาหรือผู้พำนักอาศัยโดยใช้วิธีการอื่น
  • ข้าพเจ้าไม่มีส่วนเกี่ยวข้องกับพลเมืองหรือผู้พำนักในสหรัฐอเมริกาตามมาตรา 1504(a) ของ FATCA
  • ข้าพเจ้าตระหนักดีถึงความรับผิดของข้าพเจ้าในการแสดงข้อความอันเป็นเท็จ
สำหรับวัตถุประสงค์ของคำชี้แจงนี้ ประเทศและดินแดนที่อยู่ภายใต้การปกครองของสหรัฐอเมริกาทั้งหมดจะเท่ากับอาณาเขตหลักของสหรัฐอเมริกา ข้าพเจ้าให้คำมั่นที่จะปกป้องและปกป้อง Octa Markets Incorporated กรรมการและเจ้าหน้าที่ของ Octa Markets Incorporated จากการเรียกร้องใด ๆ ที่เกิดขึ้นจากหรือเกี่ยวข้องกับการละเมิดคำชี้แจงของข้าพเจ้าในที่นี้
เราทุ่มเทให้กับความเป็นส่วนตัวและความปลอดภัยของข้อมูลส่วนบุคคลของคุณ เรารวบรวมอีเมลเพื่อมอบข้อเสนอพิเศษและข้อมูลสำคัญเกี่ยวกับผลิตภัณฑ์และบริการของเราเท่านั้น โดยการมอบที่อยู่อีเมลของคุณ คุณตกลงที่จะรับจดหมายดังกล่าวจากเรา หากคุณต้องการบอกเลิกการรับจดหมายหรือมีคำถามหรือข้อสงสัยใด ๆ กรุณาส่งไปที่ฝ่ายบริการลูกค้าของเรา
Octa trading broker
เปิดบัญชีการเทรด
Back

AUD/JPY Price Analysis: Depressed below 73.50 inside symmetrical triangle

  • AUD/JPY rolls on the late-Friday weakness from 73.64 amid broad risk-off mood.
  • A two-week-old triangle restricts the pair’s immediate moves.
  • An ascending trend line from May 06, 200-bar EMA act as additional downside filters.

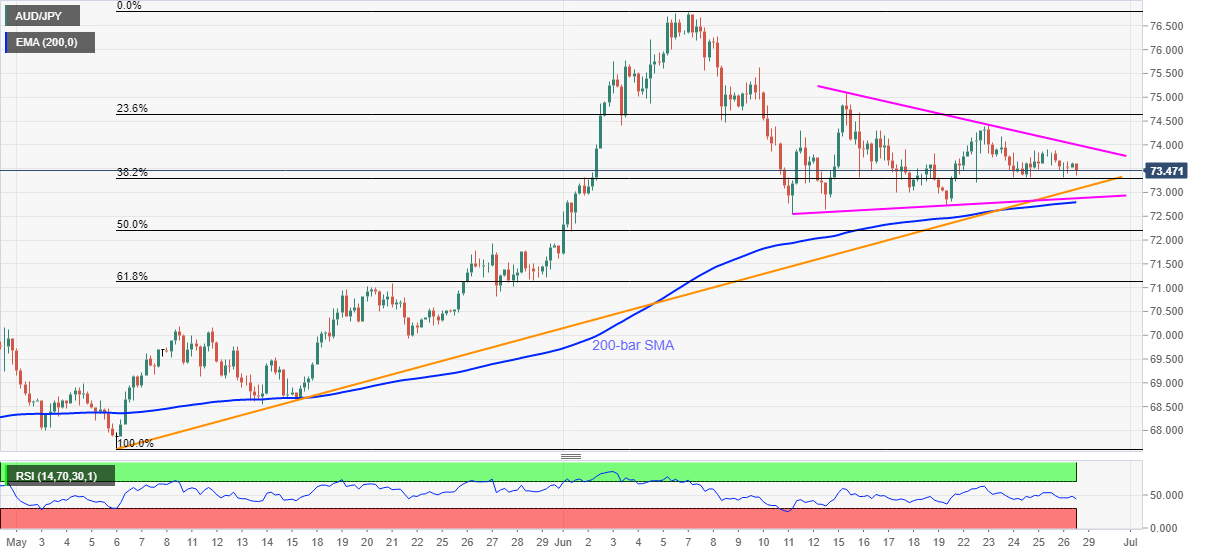
AUD/JPY bounces off intraday low of 73.36 to 73.47 during the early Asian session on Monday. Though, the pair keeps the short-term symmetrical triangle formation intact despite the last week’s downbeat performance.

Even so, an upward sloping trend line from early-May, at 73.07 now, seems to lure the bears ahead of highlighting the triangle’s support line near 72.85. Also acting as the near-term key support is the 200-bar SMA near 72.80.

Hence, the sellers may await a clear break below 72.80 to aim for late-May top surrounding 71.90 whereas any more downside could push them towards 61.8% Fibonacci retracement of May-June upside, near 71.10.

Alternatively, the resistance line of the said triangle formation, currently near 74.00, becomes an immediate upside barrier to watch, a break of which could aim for 74.40 and the mid-month high 75.10.

In a case where the bulls remain dominant past-75.10, 75.70 and 76.25/30 might offer intermediate halts before challenging the monthly high around 76.80.

AUD/JPY four-hour chart

Trend: SIdeways


Gold Price Analysis: XAU/USD refreshes multi-year high above $1,775 as virus woes deepen

Gold prices trade near $1,775, intraday high of $1,775.94, during the early Monday morning in Asia. The bullion recently surged to the fresh high over
อ่านเพิ่มเติม Previous