Confirming you are not from the U.S. or the Philippines

โดยการให้คำชี้แจงนี้ ข้าพเจ้าขอประกาศและยืนยันอย่างชัดเจนว่า:
  • ข้าพเจ้ามิใช่พลเมืองหรือผู้ที่พำนักอาศัยสหรัฐอเมริกา
  • ฉันไม่ใช่ผู้พำนักอาศัยในฟิลิปปินส์
  • ข้าพเจ้าไม่ได้เป็นเจ้าของหุ้น/สิทธิ์ในการออกเสียง/ผลประโยชน์ของผู้พำนักในสหรัฐอเมริกาทั้งทางตรงและทางอ้อมเกินกว่า 10% และ/หรือไม่ได้ควบคุมพลเมืองหรือผู้พำนักในสหรัฐอเมริกาด้วยวิธีการอื่น
  • ข้าพเจ้าไม่ได้อยู่ภายใต้ความเป็นเจ้าของโดยตรงหรือโดยอ้อมมากกว่า 10% ของจำนวนหุ้น/สิทธิในการออกเสียง/ดอกเบี้ยและ/หรืออยู่ภายใต้การควบคุมของพลเมืองสหรัฐอเมริกาหรือผู้พำนักอาศัยโดยใช้วิธีการอื่น
  • ข้าพเจ้าไม่มีส่วนเกี่ยวข้องกับพลเมืองหรือผู้พำนักในสหรัฐอเมริกาตามมาตรา 1504(a) ของ FATCA
  • ข้าพเจ้าตระหนักดีถึงความรับผิดของข้าพเจ้าในการแสดงข้อความอันเป็นเท็จ
สำหรับวัตถุประสงค์ของคำชี้แจงนี้ ประเทศและดินแดนที่อยู่ภายใต้การปกครองของสหรัฐอเมริกาทั้งหมดจะเท่ากับอาณาเขตหลักของสหรัฐอเมริกา ข้าพเจ้าให้คำมั่นที่จะปกป้องและปกป้อง Octa Markets Incorporated กรรมการและเจ้าหน้าที่ของ Octa Markets Incorporated จากการเรียกร้องใด ๆ ที่เกิดขึ้นจากหรือเกี่ยวข้องกับการละเมิดคำชี้แจงของข้าพเจ้าในที่นี้
เราทุ่มเทให้กับความเป็นส่วนตัวและความปลอดภัยของข้อมูลส่วนบุคคลของคุณ เรารวบรวมอีเมลเพื่อมอบข้อเสนอพิเศษและข้อมูลสำคัญเกี่ยวกับผลิตภัณฑ์และบริการของเราเท่านั้น โดยการมอบที่อยู่อีเมลของคุณ คุณตกลงที่จะรับจดหมายดังกล่าวจากเรา หากคุณต้องการบอกเลิกการรับจดหมายหรือมีคำถามหรือข้อสงสัยใด ๆ กรุณาส่งไปที่ฝ่ายบริการลูกค้าของเรา
Octa trading broker
เปิดบัญชีการเทรด
Back

AUD/JPY Price Analysis: Bears looking for monthly weekly and daily bearish confluence

  • AUD/JPY is an attractive short below the daily structure.
  • Currently, the stars do not quite align across all time frames from a top-down market structure analysis. 

The Monthly is bearish and is looking as though it wants to form a head and shoulders.

The weekly is proving that there is resistance that first needs to hold the bullish commitments at this juncture.

The daily chart has a strong bullish bias while holding above a strong support structure along with the ascending trendline support.

Monthly chart
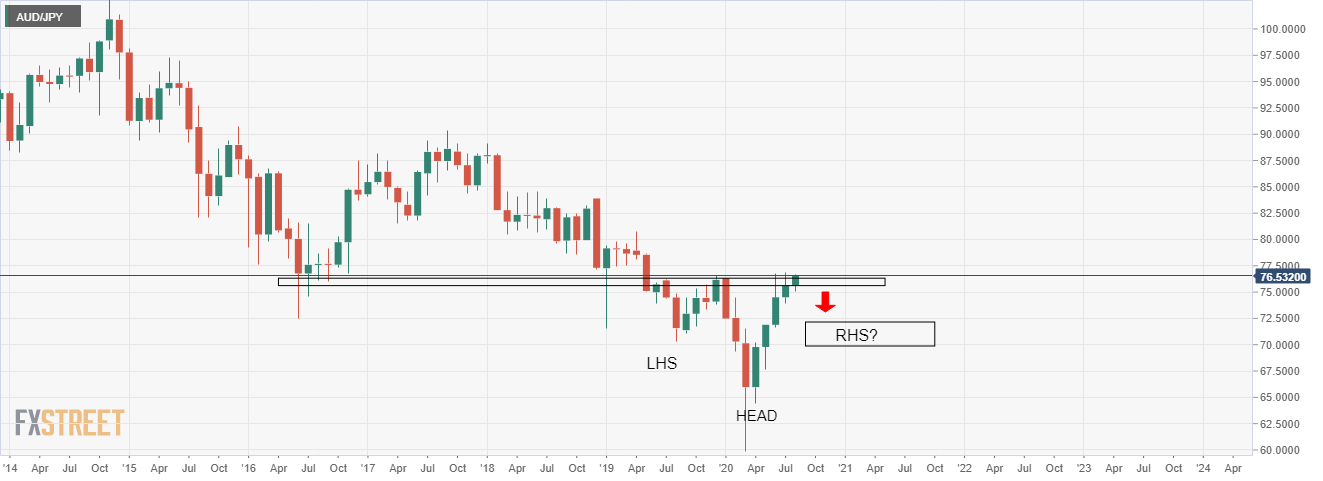
The above chart shows a potential reversal head and shoulders pattern in the making, offering downside target opportunities for the bears. 

Weekly chart

The weekly chart is showing that the bulls are trying for a second attempt a the resistance. Should they fail, the prospects for the head and shoulders are sound.

Daily chart

The daily support structure is a confluence of higher lows, the support trendline and a restest of the structure which confirms a bullish bias.


However, should the same confluence breakdown, then bears will be looking to take over in the barroom brawl zone and a shorting opportunity on a retest of broken support structure turned resistance. 

When is the Australia unemployment rate and how could it affect AUD/USD?

July month employment statistics from the Australian Bureau of Statistics, up for publishing at 01:30 GMT on Thursday, will be the immediate catalyst
อ่านเพิ่มเติม Previous

EUR/USD Price Analysis: Falling wedge breakout suggests bull revival

EUR/USD is currently chipping away at the psychological hurdle of 1.18, having put in a low of 1.1711 on Wednesday. The 4-hour chart shows a falling w
อ่านเพิ่มเติม Next