Confirming you are not from the U.S. or the Philippines

โดยการให้คำชี้แจงนี้ ข้าพเจ้าขอประกาศและยืนยันอย่างชัดเจนว่า:
  • ข้าพเจ้ามิใช่พลเมืองหรือผู้ที่พำนักอาศัยสหรัฐอเมริกา
  • ฉันไม่ใช่ผู้พำนักอาศัยในฟิลิปปินส์
  • ข้าพเจ้าไม่ได้เป็นเจ้าของหุ้น/สิทธิ์ในการออกเสียง/ผลประโยชน์ของผู้พำนักในสหรัฐอเมริกาทั้งทางตรงและทางอ้อมเกินกว่า 10% และ/หรือไม่ได้ควบคุมพลเมืองหรือผู้พำนักในสหรัฐอเมริกาด้วยวิธีการอื่น
  • ข้าพเจ้าไม่ได้อยู่ภายใต้ความเป็นเจ้าของโดยตรงหรือโดยอ้อมมากกว่า 10% ของจำนวนหุ้น/สิทธิในการออกเสียง/ดอกเบี้ยและ/หรืออยู่ภายใต้การควบคุมของพลเมืองสหรัฐอเมริกาหรือผู้พำนักอาศัยโดยใช้วิธีการอื่น
  • ข้าพเจ้าไม่มีส่วนเกี่ยวข้องกับพลเมืองหรือผู้พำนักในสหรัฐอเมริกาตามมาตรา 1504(a) ของ FATCA
  • ข้าพเจ้าตระหนักดีถึงความรับผิดของข้าพเจ้าในการแสดงข้อความอันเป็นเท็จ
สำหรับวัตถุประสงค์ของคำชี้แจงนี้ ประเทศและดินแดนที่อยู่ภายใต้การปกครองของสหรัฐอเมริกาทั้งหมดจะเท่ากับอาณาเขตหลักของสหรัฐอเมริกา ข้าพเจ้าให้คำมั่นที่จะปกป้องและปกป้อง Octa Markets Incorporated กรรมการและเจ้าหน้าที่ของ Octa Markets Incorporated จากการเรียกร้องใด ๆ ที่เกิดขึ้นจากหรือเกี่ยวข้องกับการละเมิดคำชี้แจงของข้าพเจ้าในที่นี้
เราทุ่มเทให้กับความเป็นส่วนตัวและความปลอดภัยของข้อมูลส่วนบุคคลของคุณ เรารวบรวมอีเมลเพื่อมอบข้อเสนอพิเศษและข้อมูลสำคัญเกี่ยวกับผลิตภัณฑ์และบริการของเราเท่านั้น โดยการมอบที่อยู่อีเมลของคุณ คุณตกลงที่จะรับจดหมายดังกล่าวจากเรา หากคุณต้องการบอกเลิกการรับจดหมายหรือมีคำถามหรือข้อสงสัยใด ๆ กรุณาส่งไปที่ฝ่ายบริการลูกค้าของเรา
Back

USD/JPY Price Analysis: 100-HMA support tested after symmetrical triangle breakdown

  • USD/JPY looks vulnerable below 100-HMA at 106.15.
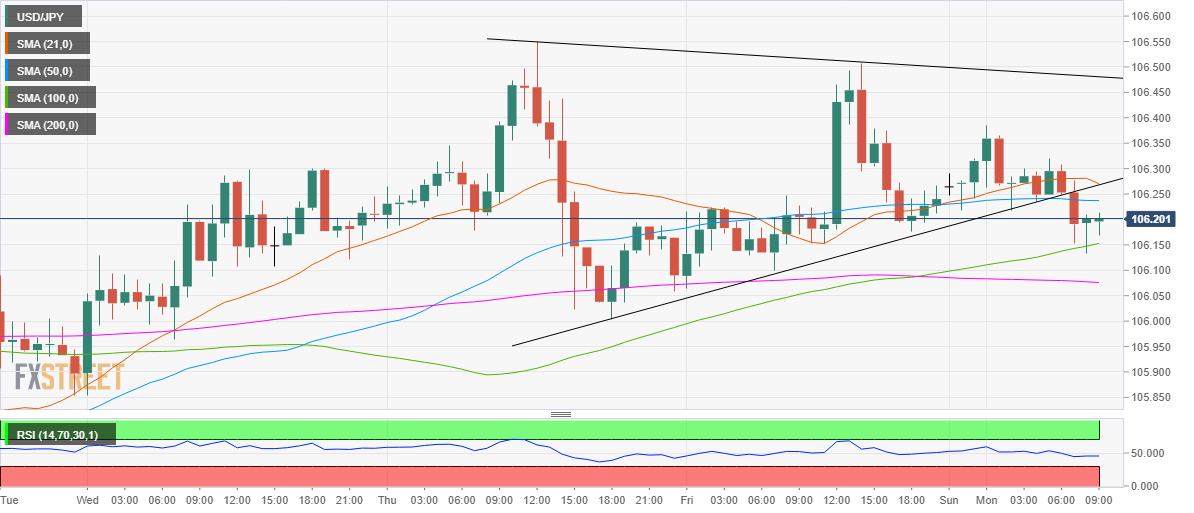
  • Symmetrical triangle breakdown confirmed on the hourly chart.
  • Bearish RSI calls for additional downside in the near-term.

USD/JPY finally broke its Asian consolidative mode to the downside, as the sellers took over control despite the risk-on action in the European equities and a broadly higher US dollar.

The renewed weakness in the spot can be mainly attributed to chart-based selling, especially after the price confirmed a symmetrical triangle breakdown on the hourly sticks.

At the moment, the pair is trying hard to hold onto the powerful 100-hourly Simple Moving Average (HMA) support at 106.15. The hourly Relative Strength Index (RSI) trades flat below the midline, suggesting more scope to the downside.

The horizontal 200-HMA support at 106.07 will be a tough nut to crack for the bears.

On the flip side, the 50-HMA at 106.23 could likely cap the immediate pullback. Acceptance above the latter could bring the robust support now turned resistance at 106.27 back in play. That level is the confluence of the bearish 21-HMA and the pattern support.  

USD/JPY: Hourly chart

fxsoriginal


USD/JPY: Additional levels


USD/CAD: Fed's reflation policy to drive the dive to 1.28 – NBF

The new guidelines for US monetary policy coupled with a stronger-than-expected Canadian economic rebound in Q3 provided support to the CAD in August.
อ่านเพิ่มเติม Previous

GBP/USD Analysis: Bears looking to seize control amid fresh Brexit jitters

The GBP/USD pair failed to capitalize on Friday's goodish rebound of around 100 pips, instead met with some fresh supply on the first day of a new tra
อ่านเพิ่มเติม Next