Confirming you are not from the U.S. or the Philippines

โดยการให้คำชี้แจงนี้ ข้าพเจ้าขอประกาศและยืนยันอย่างชัดเจนว่า:
  • ข้าพเจ้ามิใช่พลเมืองหรือผู้ที่พำนักอาศัยสหรัฐอเมริกา
  • ฉันไม่ใช่ผู้พำนักอาศัยในฟิลิปปินส์
  • ข้าพเจ้าไม่ได้เป็นเจ้าของหุ้น/สิทธิ์ในการออกเสียง/ผลประโยชน์ของผู้พำนักในสหรัฐอเมริกาทั้งทางตรงและทางอ้อมเกินกว่า 10% และ/หรือไม่ได้ควบคุมพลเมืองหรือผู้พำนักในสหรัฐอเมริกาด้วยวิธีการอื่น
  • ข้าพเจ้าไม่ได้อยู่ภายใต้ความเป็นเจ้าของโดยตรงหรือโดยอ้อมมากกว่า 10% ของจำนวนหุ้น/สิทธิในการออกเสียง/ดอกเบี้ยและ/หรืออยู่ภายใต้การควบคุมของพลเมืองสหรัฐอเมริกาหรือผู้พำนักอาศัยโดยใช้วิธีการอื่น
  • ข้าพเจ้าไม่มีส่วนเกี่ยวข้องกับพลเมืองหรือผู้พำนักในสหรัฐอเมริกาตามมาตรา 1504(a) ของ FATCA
  • ข้าพเจ้าตระหนักดีถึงความรับผิดของข้าพเจ้าในการแสดงข้อความอันเป็นเท็จ
สำหรับวัตถุประสงค์ของคำชี้แจงนี้ ประเทศและดินแดนที่อยู่ภายใต้การปกครองของสหรัฐอเมริกาทั้งหมดจะเท่ากับอาณาเขตหลักของสหรัฐอเมริกา ข้าพเจ้าให้คำมั่นที่จะปกป้องและปกป้อง Octa Markets Incorporated กรรมการและเจ้าหน้าที่ของ Octa Markets Incorporated จากการเรียกร้องใด ๆ ที่เกิดขึ้นจากหรือเกี่ยวข้องกับการละเมิดคำชี้แจงของข้าพเจ้าในที่นี้
เราทุ่มเทให้กับความเป็นส่วนตัวและความปลอดภัยของข้อมูลส่วนบุคคลของคุณ เรารวบรวมอีเมลเพื่อมอบข้อเสนอพิเศษและข้อมูลสำคัญเกี่ยวกับผลิตภัณฑ์และบริการของเราเท่านั้น โดยการมอบที่อยู่อีเมลของคุณ คุณตกลงที่จะรับจดหมายดังกล่าวจากเรา หากคุณต้องการบอกเลิกการรับจดหมายหรือมีคำถามหรือข้อสงสัยใด ๆ กรุณาส่งไปที่ฝ่ายบริการลูกค้าของเรา
Octa trading broker
เปิดบัญชีการเทรด
Back

WTI Price Analysis: 50/100-HMA confluence guards immediate upside

  • WTI prints mild losses while declining below $48.00.
  • Receding MACD histogram, strong upside hurdle challenge bulls.
  • Two-week-old horizontal support restricts short-term declines, buyers can remain hopeful beyond August top.

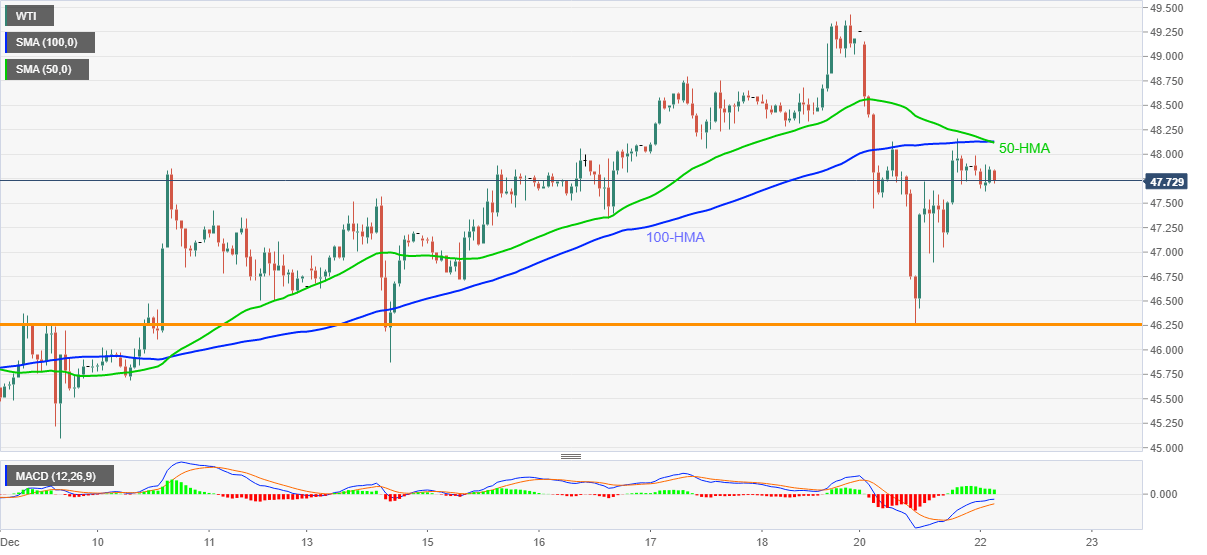
WTI eases to $47.79, down 0.10% intraday, during early Tuesday. The energy benchmark posted the biggest daily losses in six weeks the previous day. Though, a horizontal line comprising multiple levels since December 09 restricted further downside.

It should, however, be noted that the corrective recovery beyond the stated support line fails to cross a confluence of 50 and 100-HMAs. The receding upside momentum also takes clues from the MACD histogram, which in turn suggests the immediate weakness of the black gold.

As a result, the $47.00 threshold can lure the oil sellers ahead of directing them to the aforementioned support near $46.25. Though, any further weakness will not hesitate to challenge the monthly low near $44.00.

However, WTI buyers are likely to remain hopeful unless witnessing a daily closing below August month’s top near $43.85.

On the contrary, a clear break above the SMA convergence near $48.15 will quickly challenge the multi-month peak, marked last Friday, near $49.45.

Overall, the energy prices are in an uptrend that eyes the $50.00 threshold.

WTI hourly chart
Trend: Bullish


Gold Price Analysis: XAU/USD battles 50-HMA on the road to recovery

Gold (XAU/USD) witnessed good two-way businesses on Monday, as traders danced to the tune of the optimism on the agreement of a US stimulus deal in th
อ่านเพิ่มเติม Previous

Asian Stock Market: Pressured over covid variant as US Congress ready the stimulus

Asian equities stay depressed during early Tuesday as the coronavirus (COVID-19) variant renews fears of another pandemic even as global vaccine manuf
อ่านเพิ่มเติม Next