Confirming you are not from the U.S. or the Philippines

โดยการให้คำชี้แจงนี้ ข้าพเจ้าขอประกาศและยืนยันอย่างชัดเจนว่า:
  • ข้าพเจ้ามิใช่พลเมืองหรือผู้ที่พำนักอาศัยสหรัฐอเมริกา
  • ฉันไม่ใช่ผู้พำนักอาศัยในฟิลิปปินส์
  • ข้าพเจ้าไม่ได้เป็นเจ้าของหุ้น/สิทธิ์ในการออกเสียง/ผลประโยชน์ของผู้พำนักในสหรัฐอเมริกาทั้งทางตรงและทางอ้อมเกินกว่า 10% และ/หรือไม่ได้ควบคุมพลเมืองหรือผู้พำนักในสหรัฐอเมริกาด้วยวิธีการอื่น
  • ข้าพเจ้าไม่ได้อยู่ภายใต้ความเป็นเจ้าของโดยตรงหรือโดยอ้อมมากกว่า 10% ของจำนวนหุ้น/สิทธิในการออกเสียง/ดอกเบี้ยและ/หรืออยู่ภายใต้การควบคุมของพลเมืองสหรัฐอเมริกาหรือผู้พำนักอาศัยโดยใช้วิธีการอื่น
  • ข้าพเจ้าไม่มีส่วนเกี่ยวข้องกับพลเมืองหรือผู้พำนักในสหรัฐอเมริกาตามมาตรา 1504(a) ของ FATCA
  • ข้าพเจ้าตระหนักดีถึงความรับผิดของข้าพเจ้าในการแสดงข้อความอันเป็นเท็จ
สำหรับวัตถุประสงค์ของคำชี้แจงนี้ ประเทศและดินแดนที่อยู่ภายใต้การปกครองของสหรัฐอเมริกาทั้งหมดจะเท่ากับอาณาเขตหลักของสหรัฐอเมริกา ข้าพเจ้าให้คำมั่นที่จะปกป้องและปกป้อง Octa Markets Incorporated กรรมการและเจ้าหน้าที่ของ Octa Markets Incorporated จากการเรียกร้องใด ๆ ที่เกิดขึ้นจากหรือเกี่ยวข้องกับการละเมิดคำชี้แจงของข้าพเจ้าในที่นี้
เราทุ่มเทให้กับความเป็นส่วนตัวและความปลอดภัยของข้อมูลส่วนบุคคลของคุณ เรารวบรวมอีเมลเพื่อมอบข้อเสนอพิเศษและข้อมูลสำคัญเกี่ยวกับผลิตภัณฑ์และบริการของเราเท่านั้น โดยการมอบที่อยู่อีเมลของคุณ คุณตกลงที่จะรับจดหมายดังกล่าวจากเรา หากคุณต้องการบอกเลิกการรับจดหมายหรือมีคำถามหรือข้อสงสัยใด ๆ กรุณาส่งไปที่ฝ่ายบริการลูกค้าของเรา
Back

Gold Price Analysis: XAU/USD bulls earmark $1,975 bullish level

  • Gold prices could be due for a bullish retest of resistance. 
  • XAU/USD has met a significant Fibonacci retracement level on the daily chart that is expected to hold. 

The monthly chart shows that the correction of the bullish trend met a 50% mean reversion before recovering into what would be expected to to be the start of a fresh bullish impulse that should exceed the record highs at some stage later this year. 

Monthly chart
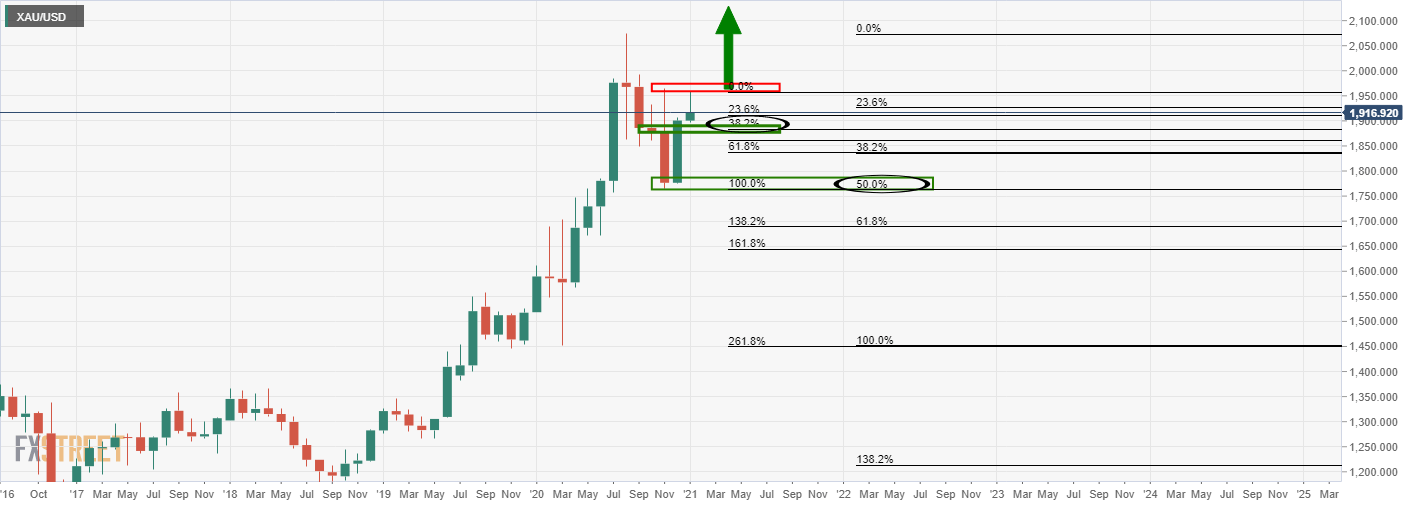
A 38.2% Fibonacci retracement of this current bullish leg's highs meets prior structure and would be expected to support the pullback from resistance. 

Weekly chart
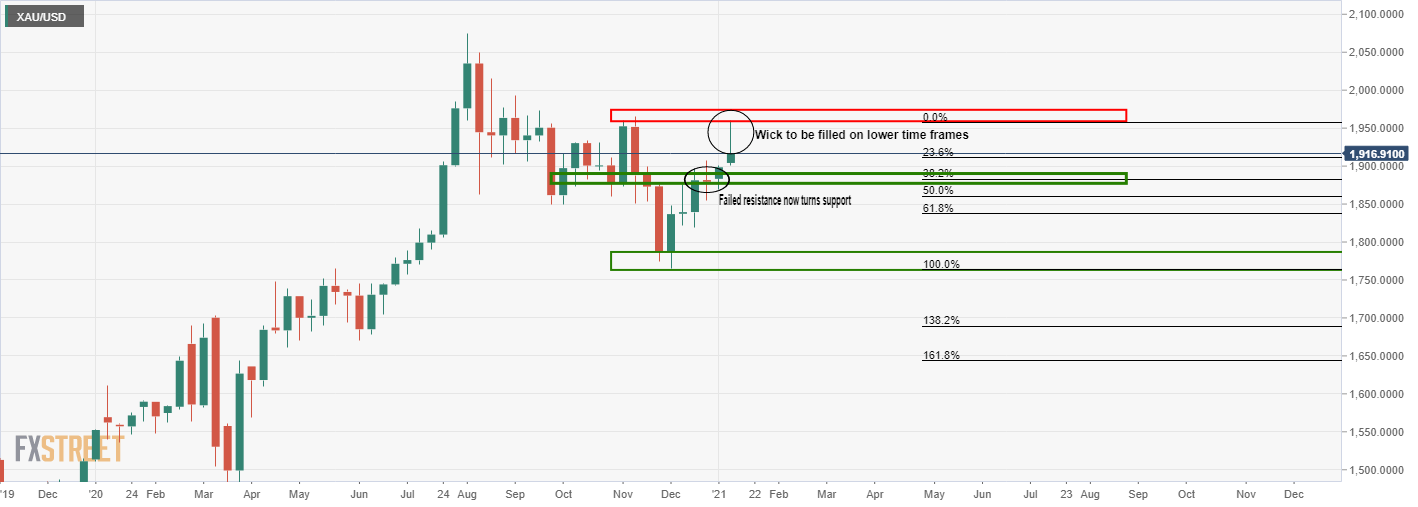
Meanwhile, the weekly chart's price rejection from a secondary resistance is leaving a wick that would be expected to be filled on the lower time frames. 

Daily chart
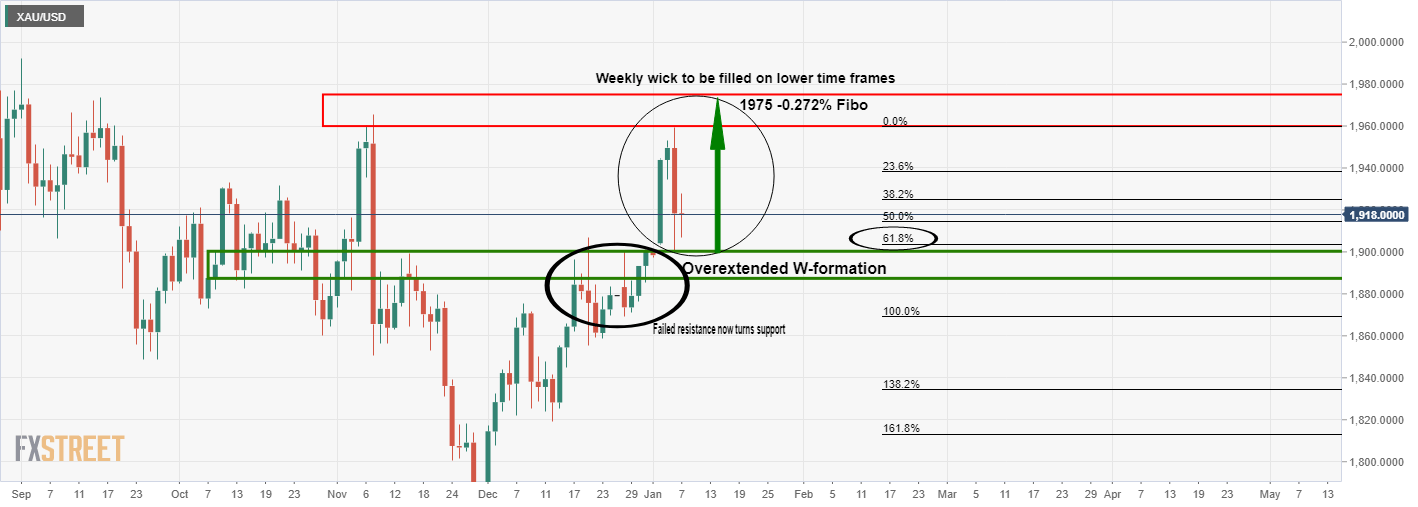
Consequently, the daily chart's bearish correction of the overextended W-formation's impulse has stalled at a 61.8% Fibo.

This leaves a bullish bias towards a -0.272% Fibonacci of the correction's tops to current lows as a target. 

Meanwhile, the price will very much depend on the US dollar's trajectory.

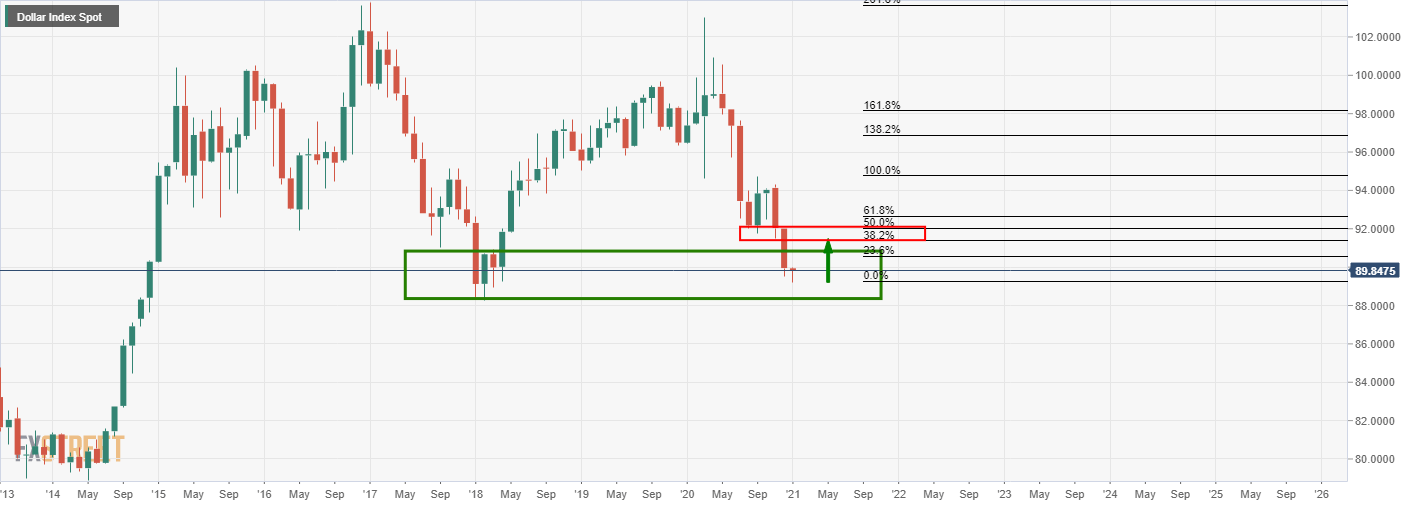
From a monthly perspective, the greenback is testing a demand area and the path of least resistance could well be to the upside at this juncture.

Therefore, the near term prospects for gold are limited to the upside while the US dollar corrects a significant portion of the monthly trend.

DXY monthly chart
Fed’s Kaplan: Expect yields to rise due to better outlook

Dallas Fed President Kaplan who is a nonvoter and renowned to be dovish spoke on Thursday. He expects US Gross Domestic Product to grow this year arou
อ่านเพิ่มเติม Previous

EUR/USD ignores barrage of Fedspeak, consolidates above 1.2250

EUR/USD is consolidating just to the north of the 1.2250 mark after dropping about 0.5% or roughly 60 pips on the day as a result of a resurgent US do
อ่านเพิ่มเติม Next